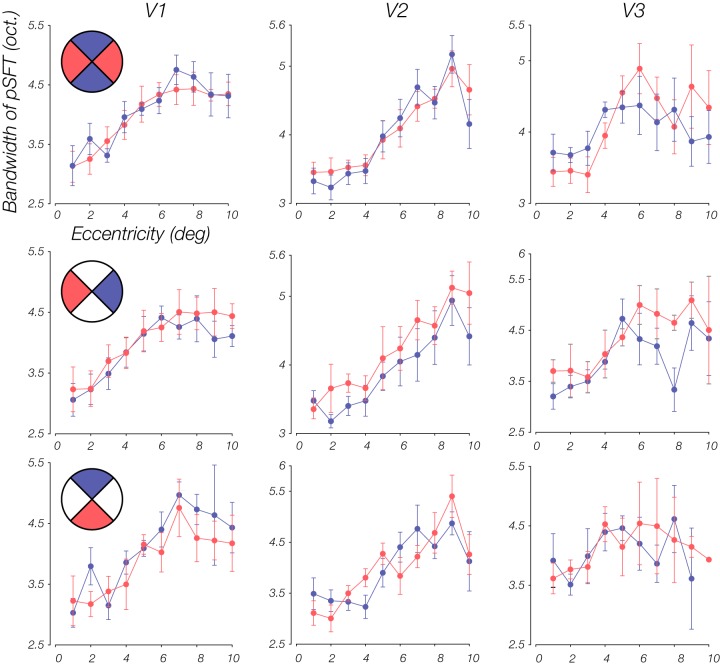
Fig. 9.
Comparison of bandwidth estimates between different quadrants sets of the visual field. The t tests on the differences between right and left quadrants in V2 and V3 were significant [V2: t(73) = −2.14, P = 0.04; V3: t(64) = −2.86, P = 0.01]. In other cases, the null hypothesis was not rejected. Quadrant ranges include [−45°,45°], [45°,135°], [135°,225°], and [225°,315°]. Error bars represent means ± 1 SE. pSFT, population spatial frequency tuning.

