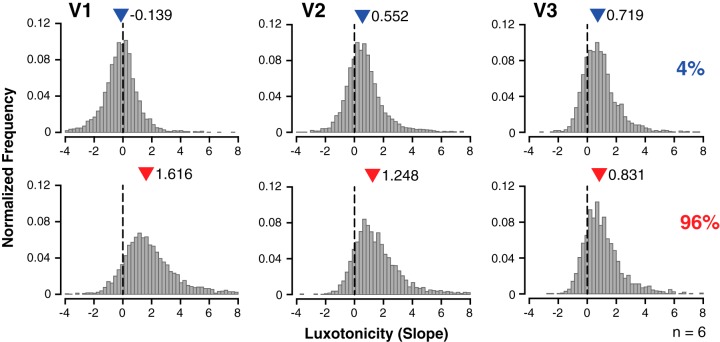
Fig. 4.
Variability of voxelwise luxotonic activity within and across early visual cortex. Data are normalized frequency distributions of best-fitting linear regression slope estimates (binwidth = 0.24) demonstrating the variety of luxotonicity at the voxelwise level for all participants (n = 6) within early visual cortex (V1–V3). Steeper (more positive) slope estimates indicate a stronger luminance-based response. The median measurement for each distribution is denoted by a colored triangle, along with the specific median measurement. Each row corresponds to a particular contrast condition in experiment 2.

