Fig. 1.
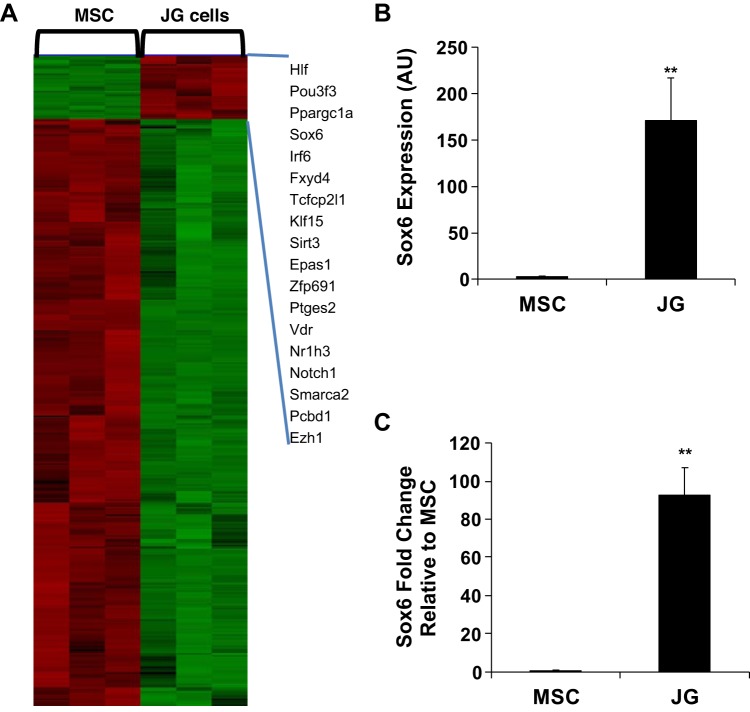
Sox6 expression is upregulated in juxtaglomerular (JG) cells compared with renal mesenchymal stromal cells (MSCs). A: heat map showing the microarray data comparison between renal CD44+ MSCs and JG cells. Data were analyzed using d-Chip, which focuses on transcriptional regulators. Genes upregulated ≥5-fold in JG cells are presented on the right side of the heat map. B: microarray expression data of Sox6 in renal MSCs and JG cells. C: Sox6 quantitative real-time PCR validation of microarray data. Expression values for Sox6 are shown relative to GAPDH. There were at least 4 independent samples/group. P values were calculated using a Student’s unpaired t test. **P < 0.01. AU, arbitrary units.

