Fig. 5.
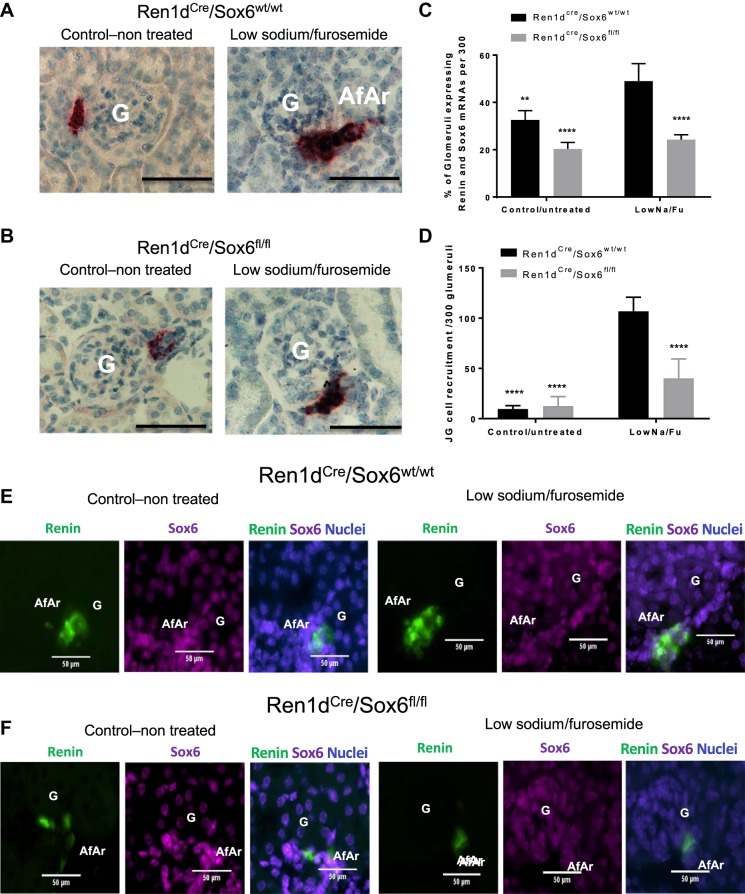
Specific knockout of Sox6 in renin-expressing cells inhibits juxtaglomerular (JG) cell recruitment during low-Na+ and furosemide (LowNa/Fu) treatment. After 10 days of LowNa/Fu treatment, kidneys were isolated, perfusion fixed with 10% neutral buffered formalin solution, dehydrated in a graduated ethanol series, and embedded in paraffin. Renin (red) mRNA amplification was performed following the manufacturer’s instructions. Red staining represents renin mRNA expression. Specific knockout of Sox6 in JG cells inhibited the increase in renin mRNA expression in cells along the afferent arteriole during JG cell recruitment. A: control untreated and LowNa/Fu-treated Ren1dCre/Sox6wt/wt mice. B: control untreated and LowNa/Fu-treated Ren1dCre/Sox6fl/fl mice. Representative microscopy images are shown. G, glomerulus; AfAr, afferent arteriole. Magnification: ×60. Scale bars = 20 μm. C: quantification of at least 300 glomeruli/sample expressing renin mRNA along the afferent arteriole from the in situ hybridization experiments. Specific probes for renin (red) were used to detect renin mRNA. Data are presented as means ± SE; n = 4. P values were was calculated with one-way ANOVA followed by a Tukey post hoc test. **P < 0.01; ****P < 0.0001. Specific fluorescent probes for renin (opal 520, green) and Sox6 (opal 650, magenta) were used to detect renin and Sox6 mRNA, respectively. DAPI was used as a nuclear stain. D: quantification of JG cell recruitment along the afferent arteriole in at least 300 glomeruli/sample expressing renin and Sox6 mRNA from the in situ hybridization experiments. Specific probes for renin (green) and Sox6 (magenta) were used to detect renin and Sox6 mRNAs. Data are presented as means ± SE; n = 4. P values were was calculated with one-way ANOVA followed by a Tukey post hoc test. ****P < 0.0001. E: control untreated and LowNa/Fu-treated Ren1dCre/Sox6wt/wt mice. F: control untreated and LowNa/Fu-treated Ren1dCre/Sox6fl/fl mice. Representative microscopy images are shown. Magnification: ×30. Scale bars = 50 μm.

