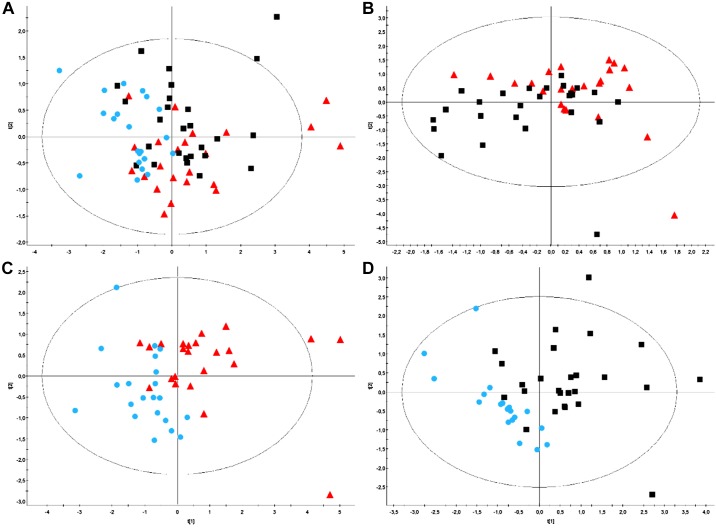
Fig. 8.
A–D: partial least squares discriminant analysis (PLS-DA) on baseline urine spectra. Patient clusters defined by classes: nicotine-session (red triangles), nicotine-free-session (black squares), and stop-session (blue dots). PLS-DA performed on baseline urine metabolome allowed us to split up the nicotine- and the stop-sessions (C) and the nicotine-free- and the stop-sessions (D) but not the nicotine- from the nicotine-free-session (B) or the other 3 sessions (A). A: model parameters: R2Xcum = 0.247; R2Ycum = 0.211; Q2cum = −0.00412; Hotelling T2 = 0.95, Two proposed principal components. B: model parameters: R2Xcum = 0.266; R2Ycum = 0.257; Q2cum = −0.21; Hotelling’s T2 = 0.95, Two proposed principal components. C: model parameters: R2Xcum = 0.306; R2Ycum = 0.464; Q2cum = 0.135; Hotelling’s T2 = 0.95, two proposed principal components. D: model parameters: R2Xcum = 0.253; R2Ycum = 0.511; Q2cum = 0.155; Hotelling’s T2 = 0.95, two proposed principal components.

