
Fig. 3.
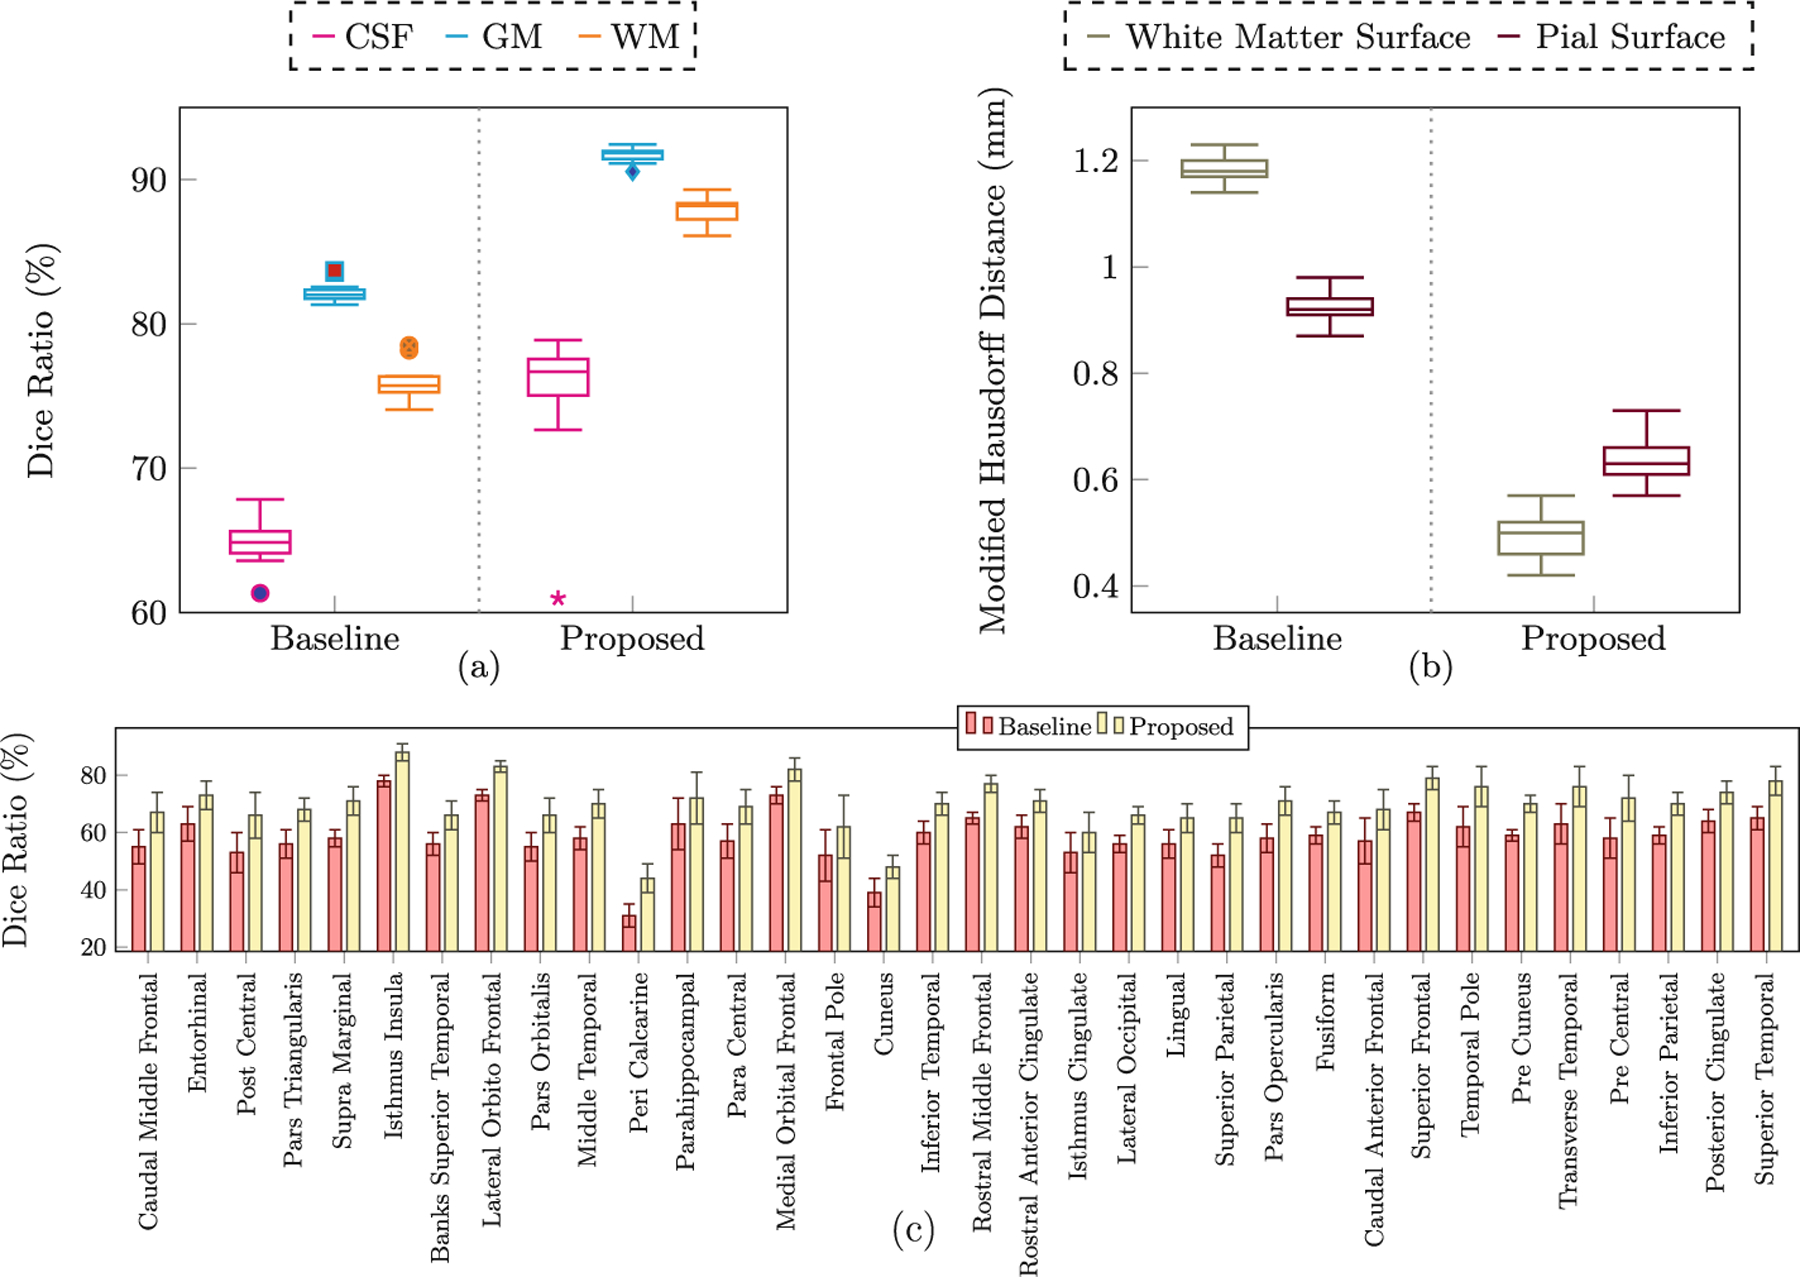
(a) Dice ratios for different tissue types. (b) Modified Hausdorff distance (mm) for the cortical surfaces. (c) Dice ratios for cortical ROIs. All results are statistically significant (p < 0.01, paired t-test)
Official websites use .gov
A
.gov website belongs to an official
government organization in the United States.
Secure .gov websites use HTTPS
A lock (
) or https:// means you've safely
connected to the .gov website. Share sensitive
information only on official, secure websites.
(a) Dice ratios for different tissue types. (b) Modified Hausdorff distance (mm) for the cortical surfaces. (c) Dice ratios for cortical ROIs. All results are statistically significant (p < 0.01, paired t-test)