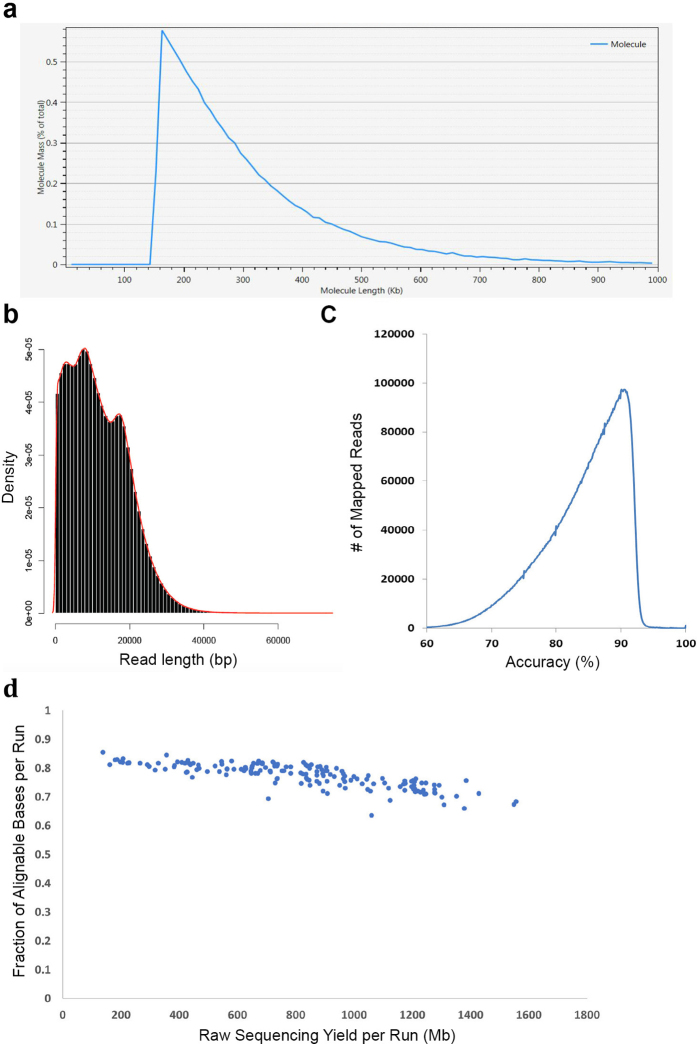
Extended Data Figure 1. Summary of data generated for genome construction.
a, Size distribution of single molecules for the optical maps. A total of 150 Gb (~60-fold coverage) of single-molecule raw data from BioNano chips was collected for map construction. The N50 of the single molecules was ~261 kb, and the label density was 11.6 per 100 kb. After assembly, the total size of the map reached 2.12 Gb with an N50 of 2.47 Mb. b, Length distribution of SMRT sequencing reads. Sequencing of 212 P6-C4 SMRT cells on the PacBio platform generated ~65-fold depth-of-coverage of the nuclear genome. Read lengths averaged 11.7 kb, with reads above 10 kb providing 53-fold depth-of-coverage. c, The accuracy of SMRT sequencing from a representative run. The sequencing error rate was estimated at 10% from the alignment with the maize B73 RefGen_v3 by BLASR. d, Plot of the fraction of alignable data per run (alignable bases/total bases per chip) versus total raw bases (per chip) for each B73 sequencing run. As the plot shows, the trend in the data suggests that as the overall per run raw base yield increases, the fraction of alignable bases decreases. This is owing to the fact that in all runs, a subset of the zero-mode waveguide (ZMWs) will initially have more than one active sequencing enzyme in the observation field at the start of the sequencing run. A ZMW with more than one active polymerase will create unalignable bases while the two polymerases are simultaneously synthesizing DNA and yield a ‘merged sequencing signal from two independent polymerases’. As the loading of a chips increases (yield of bases), the probability of having two or more polymerases in a single ZMW increases.

