
Figure 3.
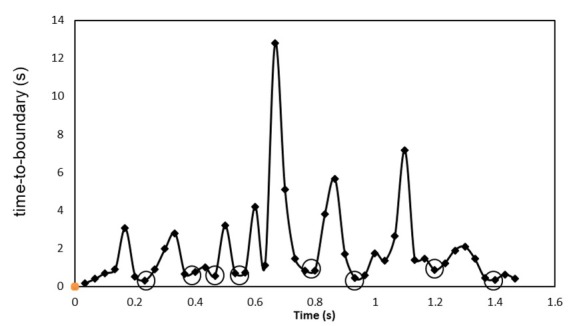
Example of a time-to-boundary data series taken during a single leg lunge over 1.5 s. Minima are indicated in circles; only the lowest values within a valley of TtB data points, as well as singular minimal TtB values qualified as minima. The black line is used purely for visualization of the data.