
Figure 2.
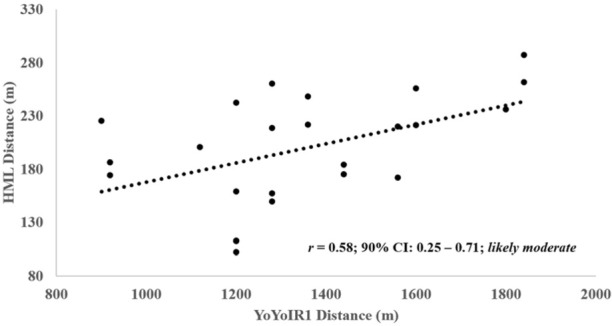
Scatter plot for the high metabolic power distance (m; ≥ 20 W·kg-1) covered during SSG and YoYoIR1 (m) performance in elite soccer players.
Official websites use .gov
A
.gov website belongs to an official
government organization in the United States.
Secure .gov websites use HTTPS
A lock (
) or https:// means you've safely
connected to the .gov website. Share sensitive
information only on official, secure websites.
Scatter plot for the high metabolic power distance (m; ≥ 20 W·kg-1) covered during SSG and YoYoIR1 (m) performance in elite soccer players.