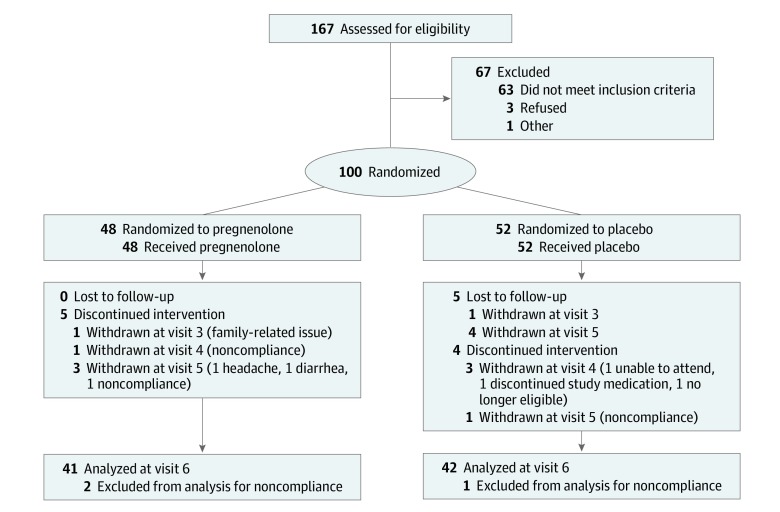
Figure 1. CONSORT Study Flow Diagram.
Treatment compliance was defined as taking between 80% and 120% of the study drug prescribed for that interval. Baseline demographic characteristics were thus calculated from 45 participants in the pregnenolone group and 49 participants in the placebo group (Table 1).

