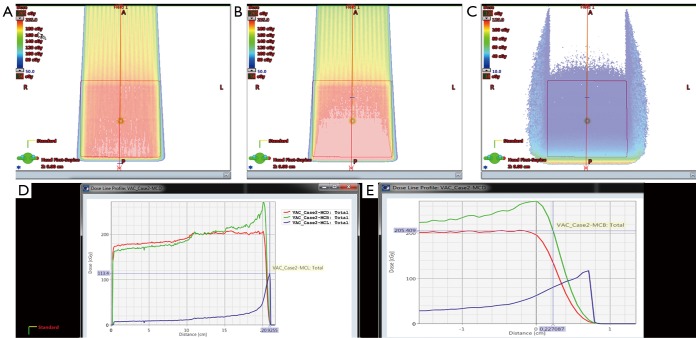
Figure 1.
The variability of the biological dose and LET for a simple homogeneous proton dose distribution. (A) Physical proton dose with the constant 1.1 RBE included; (B) biological dose derived from a linear equation relating RBE to LET (26,30); (C) LET distribution; (D,E) dose line profile with the red corresponding to the physical dose, green the biological dose, and blue the LET. Note the units for LET in this plot is (keV/µm)/10. i.e., 100=10 keV/µm. LET, linear energy transfer; RBE, relative biological effectiveness.

