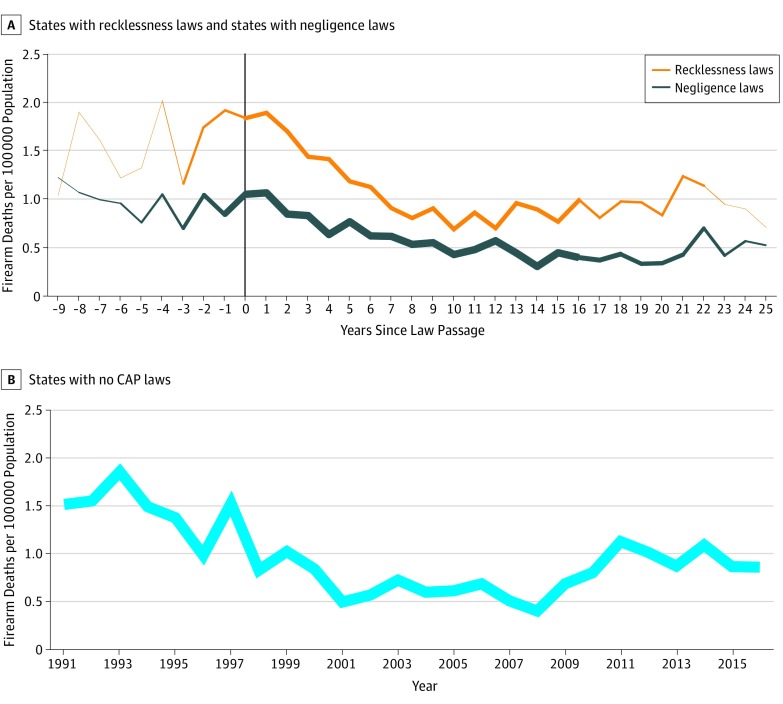
Figure 2. Rates of Firearm Fatalities per 100 000 Population.
A, States with recklessness laws and states with negligence laws, averaged by years since law passage. The vertical line at 0 indicates the first year of law passage. The thinnest sections of the line for recklessness laws at years since law passage −9 to −4 indicate from 1 to 4 states and for negligence laws at years since law passage −9 indicates 2 states. The thinnest section of the line for recklessness laws at years since law passage 23 to 25 indicates from 1 to 2 states. B, States with no child access prevention (CAP) laws, averaged by calendar year. Line thickness is proportional to the number of states that contributed data in a particular year.

