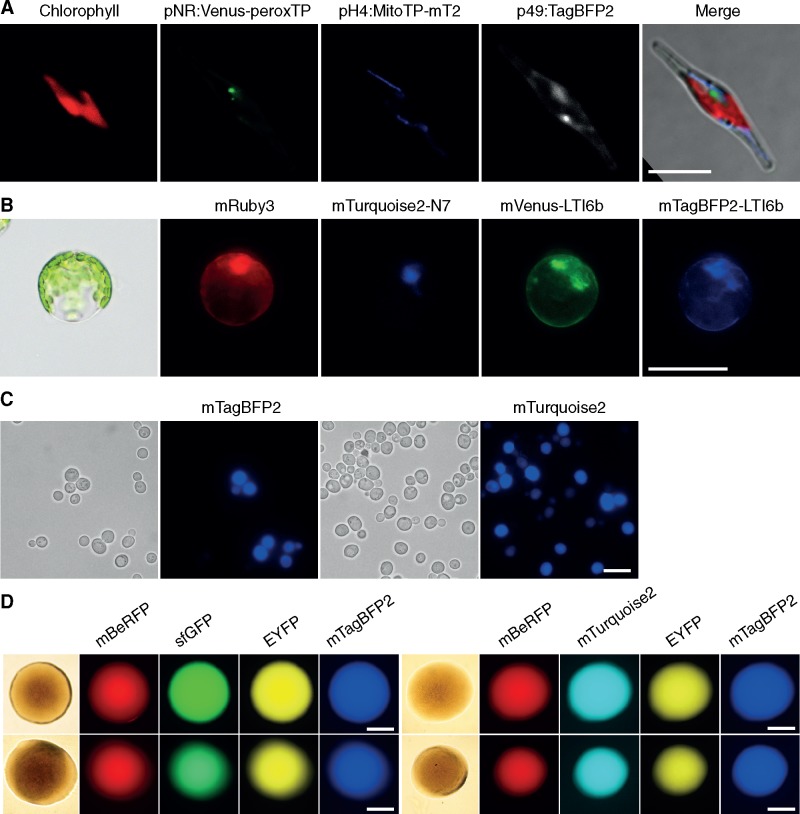
Figure 5.
Use of uLoop vectors across multiple organisms for multi-spectral fluorescence. (A) Expression of three fluorescent reporters in P. tricornutum. From left to right, Chlorophyll fluorescence, mVenus fluorescent protein fused to a peroxisomal localization tag, mTurquoise2 fluorescent protein fused to a mitochondrial localization tag and mTagBFP2 fluorescent protein expressed in the cytoplasm. Scale bar = 10 µm. (B) Expression of four fluorescent reporters in protoplasts of A. thaliana from pCAL2-1_4xFP. From left to right, mRuby3 fluorescent protein expressed in the cytoplasm, mTurquoise2 fluorescent protein fused to the nuclear localization tab N7, Venus fluorescent protein fused to plasma-membrane localization signal LTi6b and mTagBFP2 fluorescent protein fused to plasma-membrane localization signal LTi6b. Scale bar = 50 µm. (C) Expression of two fluorescent reporters in S. cerevisiae. Left, transmitted light microscopy and mTagBFP2 expression from pSB plasmid. Right, transmitted light microscopy and mTurquoise2 expression from pCA plasmid. Scale bar = 10 µm. (D) Expression of four fluorescent reporters in colonies of E. coli. Left: mBeRFP, sfGFP, EYFP and mTagBFP2 fluorescent protein expression from pCA (top) and pSB (bottom) uLoop vectors. Right: mBeRFP, mTurquoise2, EYFP and mTagBFP2 fluorescent protein expression from pCA (top) and pSB (bottom) uLoop vectors; Bottom: pSB. Scale bar = 500 µm.

