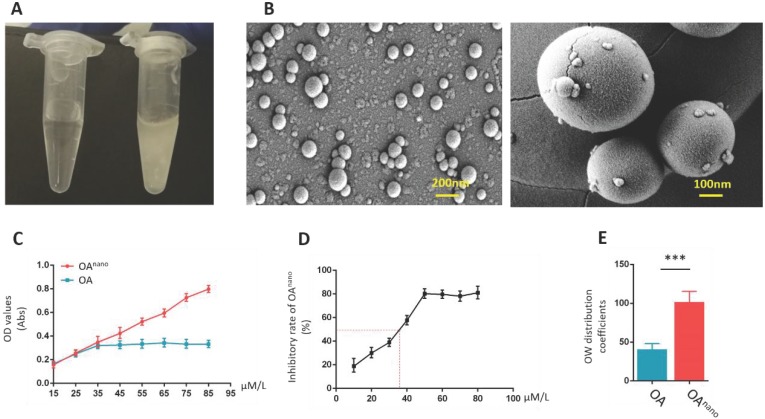
Figure 1.
Construction of OAnano and evaluation of its therapeutic effects. A. Appearance of DMSO-OAnano (left) and DMSO-OA (right) solution (50 μmol/L). B. OAnano was observed under scanning electron microscopy. C. Dissolution rates of OA and OAnano. D. IC50 of OAnano (35 μmol/L) indicated by the inhibitory rate. E. Oil-water partition coefficients of OA and OAnano.

