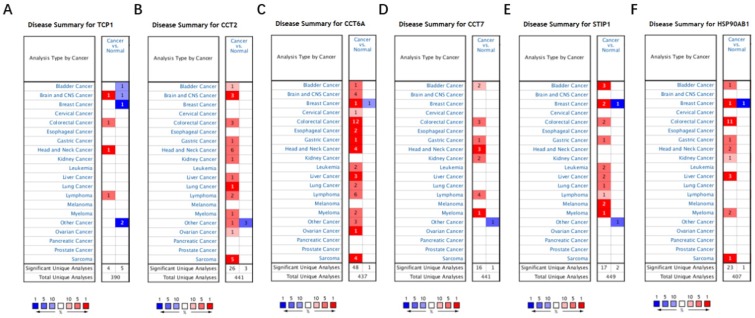
Figure 7.
The mRNA expression of FKBP4 co-expressed genes in malignant tumors (Oncomine database). The graph is a representation of the datasets with statistically significant mRNA overexpression (red) or reduced expression (blue) of TCP1, CCT2, CCT6A, CCT7, STIP1 and HSP90AB1 gene (cancer vs normal). Cell color was determined by the best gene rank percentile for the analyses within the cell, and the gene rank was analyzed by percentile of target gene in the top of all genes measured in each research.

