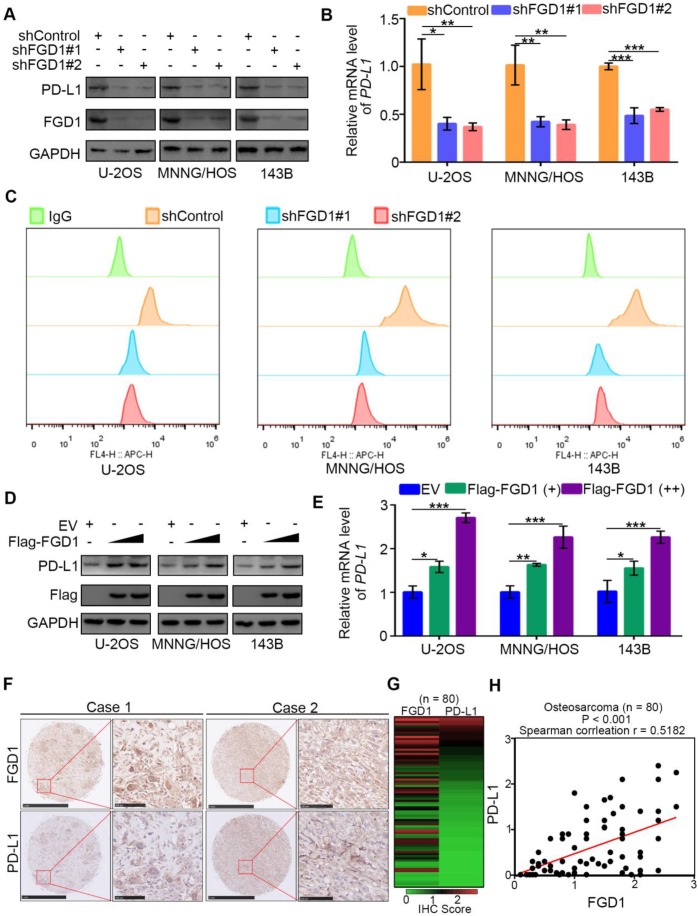
Figure 5.
FGD1 increases PD-L1 expression in OS cells. A-C, U-2OS, MNNG/HOS and 143b cells were infected with indicated shRNAs. After 72 h, cells were harvested for Western blotting analysis (A), RT-qPCR analysis (B) and flow cytometry assay (C). Date showed as Mean ± SD with three replicates. *, P < 0.05; **, P < 0.01; ***, P < 0.001. D-E, U-2OS, MNNG/HOS and 143b cells were infected with indicated plasmids. After 48 h, cells were harvested for Western blotting analysis (D), and RT-qPCR analysis (E). Date showed as Mean ± SD with three replicates. *, P < 0.05; **, P < 0.01; ***, P < 0.001. F-H, IHC analysis of FGD1 and PD-L1 in osteosarcoma tissue microarray. The typical image of IHC as presented in panel F, the IHC scores of FGD1 or PD-L1 in each osteosarcoma specimens as indicated in panel G, the correlation between FGD1 and PD-L1 as showed in panel H.

