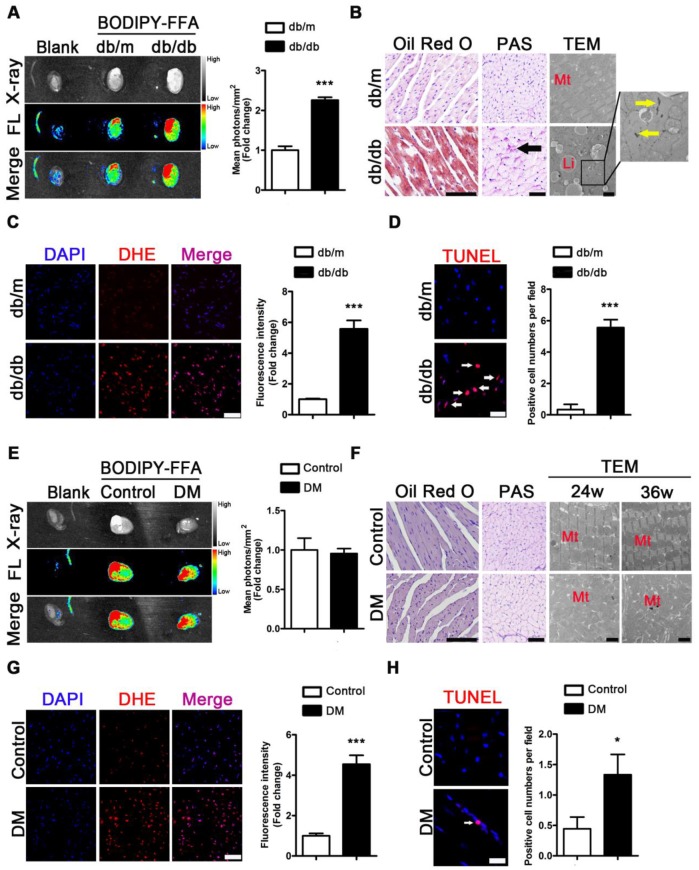
Figure 4.
Metabolic situation in hearts of obese and non-obese T2DM mice. (A) Fluorescence imaging of cardiac FFAs uptake from obese T2DM mice in the 24th week of the disease course and mean photons per square millimeter calculated. (n = 3) (B) Oil red O staining (Scale bar = 100 μm), PAS staining (Scale bar = 50 μm; Black arrow indicates glycogen particles) and TEM pictures (Scale bar = 2 μm; Mt, mitochondria; Li, lipid droplet; Yellow arrow indicates glycogen particles) of heart tissues from obese T2DM mice in the 24th week of the disease course. (C) DHE staining of heart tissues from obese T2DM mice in the 24th week of the disease course (Scale bar = 50 μm) and the fluorescence intensity. (n = 3) (D) TUNEL staining of heart tissues from obese T2DM mice in the 24th week of the disease course (Scale bar = 20 μm) and the number of apoptotic cells. (n = 3) (E) Fluorescence imaging of cardiac FFAs uptake from non-obese T2DM mice in the 36th week of the disease course and mean photons per square millimeter calculated. (n = 3) (F) Oil red O staining (Scale bar = 100 μm), PAS staining (Scale bar = 50 μm; Black arrow indicates glycogen particles) and TEM pictures (Scale bar=2 μm; Mt, mitochondria; Li, lipid droplet; Yellow arrow indicates glycogen particles) of heart tissues from non-obese T2DM mice in the 24th and/or 36th week of the disease course. (G) DHE staining of heart tissues from non-obese T2DM mice in the 36th week of the disease course (Scale bar = 50 μm) and the fluorescence intensity. (n = 3) (H) TUNEL staining of heart tissues from non-obese T2DM mice in the 36th week of the disease course (Scale bar = 20 μm) and the number of apoptotic cells. (n = 3) Data are expressed as mean ± SD. (*, p <0.05; ***, p<0.001.).

