Figure 5.
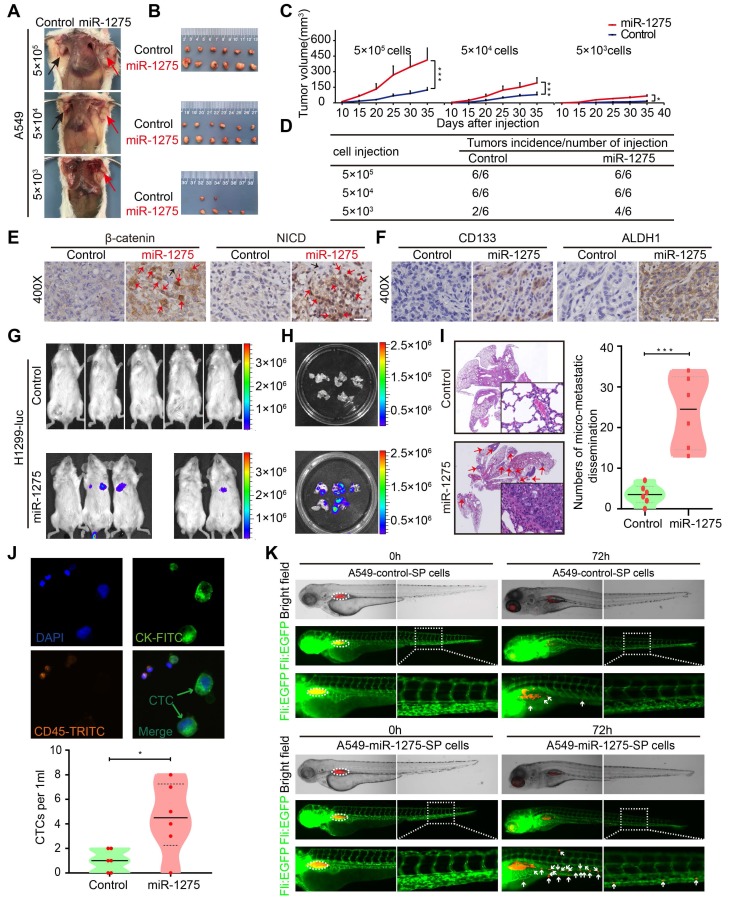
MiR-1275 promotes tumorigenicity, recurrence, and metastasis by inducing a stem cell-like phenotype. (A) Effects of miR-1275 on the tumorigenicity of A549 cells at different densities (5×10⁵, 5×10⁴, 5×10³). The black arrow indicates the control group (n=6 mice/group), and the red arrow indicates the miR-1275-overexpressing group (n=6 mice/group). (B) Subcutaneous nodules were separated and imaged at the endpoint of the experiment. (C) Tumor growth curves showing growth speed of the tumor nodules. (D) Tumorigenicity rates at different numbers of the indicated cells are shown. (E-F) Immunohistochemistry analyses of β-catenin, NICD, CD133, and ALDH1 in the tumor nodules. Red arrows indicate the nuclear enrichment of β-catenin or NICD. Scale bar, 50 μm. (G) Bioluminescence images of the mouse lung metastasis model. (H) Bioluminescence images of the metastatic lung nodules in the harvested lung tissues. (I) Micro-metastatic lesions were observed and semi-quantified by HE staining. Scale bar, 100 μm. (j) Representative images of captured CTCs intravenously injected in mice. (K) Zebrafishes were photographed at 0 h and 72 h after injection with DiI-red-labeled SP cells. Blood vasculatures are shown in green, implanted tumor areas are indicated by dashed circles, and the disseminated tumor cells are indicated by white arrowheads. Each experiment was performed three times. Data are shown as the mean ± SD, * P < 0.05, ** P < 0.01, *** P < 0.001.

