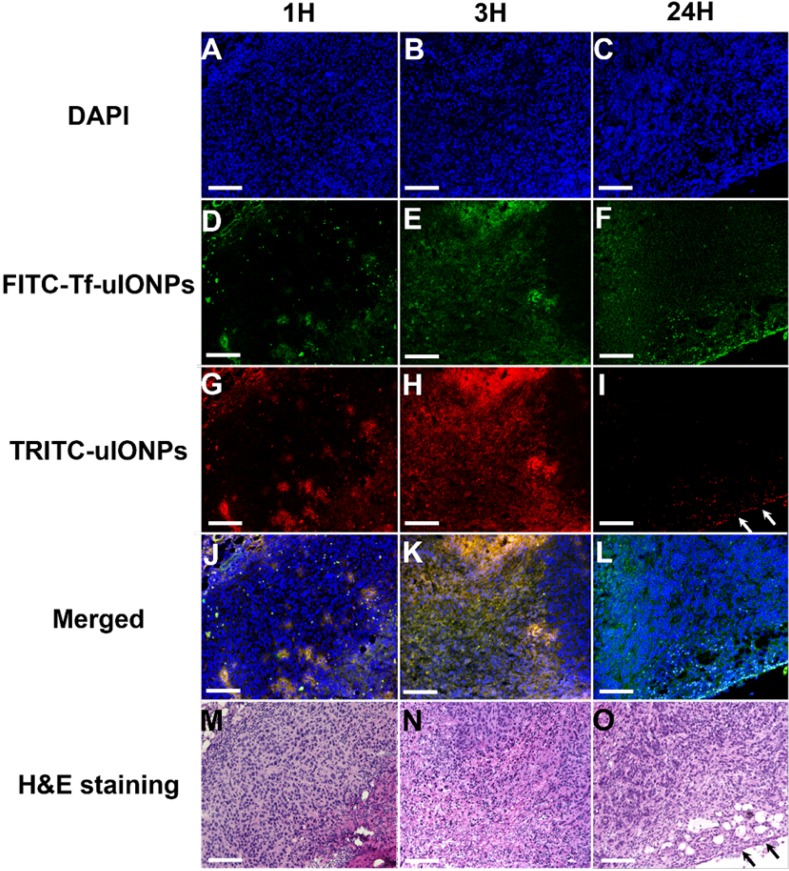
Figure 3.
Confocal microscopic images of DAPI stained nuclei (A, B, C), FITC-Tf-uIONPs (D, E, F), TRITC-uIONPs (G, H, I), merged images (J, K, L), and H&E staining (M, N, O) of tumor sections from 4T1 tumors collected at different time points (1, 3 and 24 hours) after tumor bearing mice receiving co-injection of FITC-Tf-uIONPs and TRITC-uIONPs. The arrows indicate the edge of the tumor. The scale bar for all images is 200 µm.

