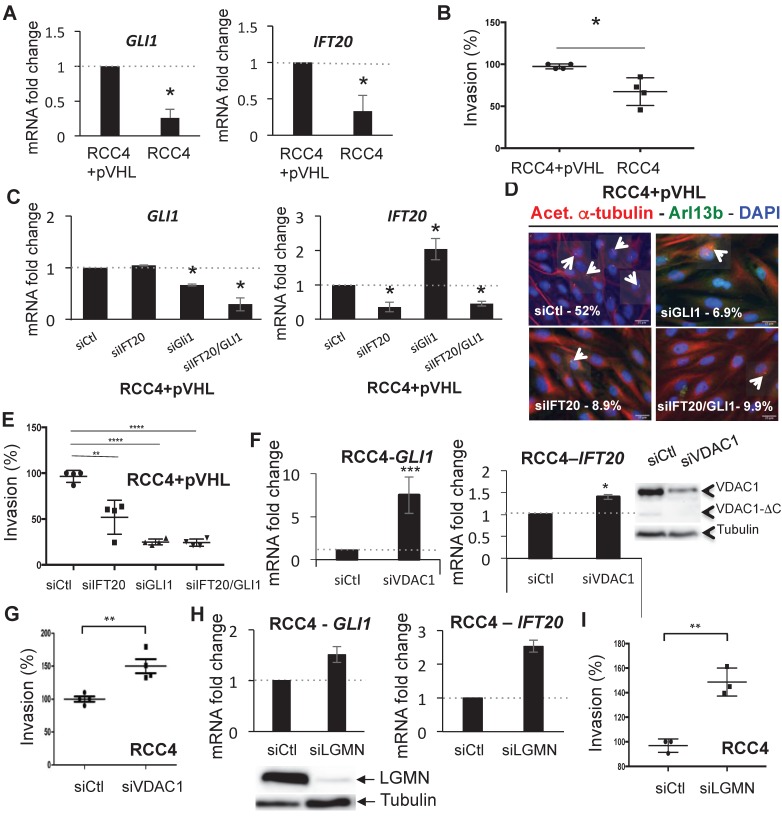
Figure 3.
GLI1/IFT20 signature is correlated to primary cilium and VDAC1. A, Histograms represent the expression of the mRNA of GLI1 (left panel) and IFT20 (right panel) in RCC4 cells compared to RCC4+pVHL in Nx. B, Graphic representation of the Boyden chamber cell-based invasion assay using RCC4+pVHL and RCC4 cells. C, RCC4+pVHL cells were transfected with control siRNA (siCtl), siGLI1 (40nM), siIFT20 (40nM) and siIFT20/GLI1 (40nM+40nM). Quantitative analysis of the ciliation percentage in RCC4+pVHL cells was assessed by confocal fluorescence microscopy (n=100-300 cells). D, Triple immunofluorescence labeling and merged images with acetylated a-tubulin (Acet. a-tubulin in red), Arl13b (in green) and DAPI (in blue). E, Graphic representation of the Boyden chamber cell-based invasion assay using RCC4+pVHL cells transfected with control siRNA (siCtl), siGLI1 (40nM), siIFT20 (40nM) and siIFT20/GLI1 40nM+40nM). F, Histograms represent the expression of the mRNA of GLI1 (left panel) and IFT20 (right panel) in RCC4 cells transfected with siRNA VDAC1. Cell lysates from the same experimetn were analyzed by immunoblotting. G, Graphic representation of the Boyden chamber cell-based invasion assay using RCC4 cells transfected with siRNA VDAC1 compared to Ctl (siCtl). H, Histograms represent the expression of the mRNA of GLI1 (left panel) and IFT20 (right panel) in RCC4 cells transfected with siRNA LGMN. Cell lysates from the same experimetn were analyzed by immunoblotting. I, Graphic representation of the Boyden chamber cell-based invasion assay using RCC4 cells transfected with siRNA LGMN compared to Ctl (siCtl). The mean ±SEM is representative of three independent experiments. A * p<0.05, ** p<0.005 and *** p<0.0005 show significant differences. Experiments have been proceeded without serum.

