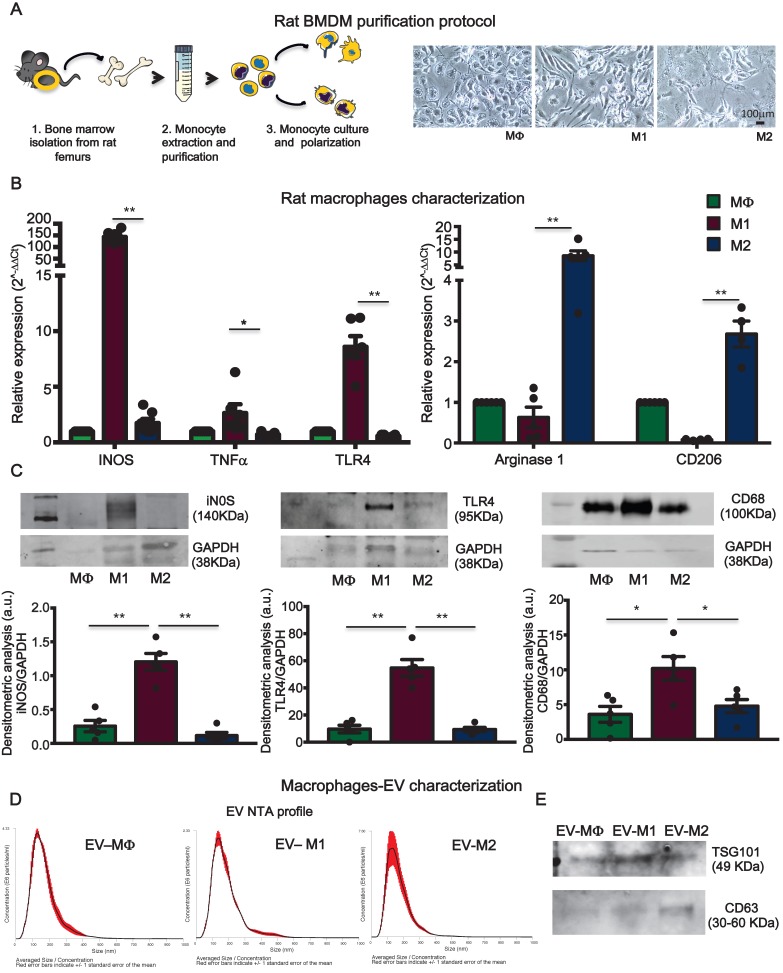
Figure 7.
Bone marrow-derived macrophages and extracellular vesicles characterization. (A) Experimental design of bone marrow-derived macrophage purification and polarization protocol. (B) Relative expression of specific M1 and M2 genes. Data show 2-DDCt values vs. MF macrophages; n=6 independent experiments (M1 markers); n=4 independent experiments (M2 marker). (C) Western blot analysis of specific macrophage markers. Quantitative densitometric data were normalized by GAPDH (n=5 independent experiments). (D) Representative dynamic light scatter profile of particle size and concentration of BMDM derived EV. Red lines represent standard deviations. (E) Western blot analysis of specific exosomal markers TSG101 and CD63. All data are presented as mean ± SEM and analyzed by one-way ANOVAs with post-hoc multiple comparisons using Bonferroni correction (*p < 0.05, **p < 0.01). Mean, SEM and statistics are reported in full in Table S7.

