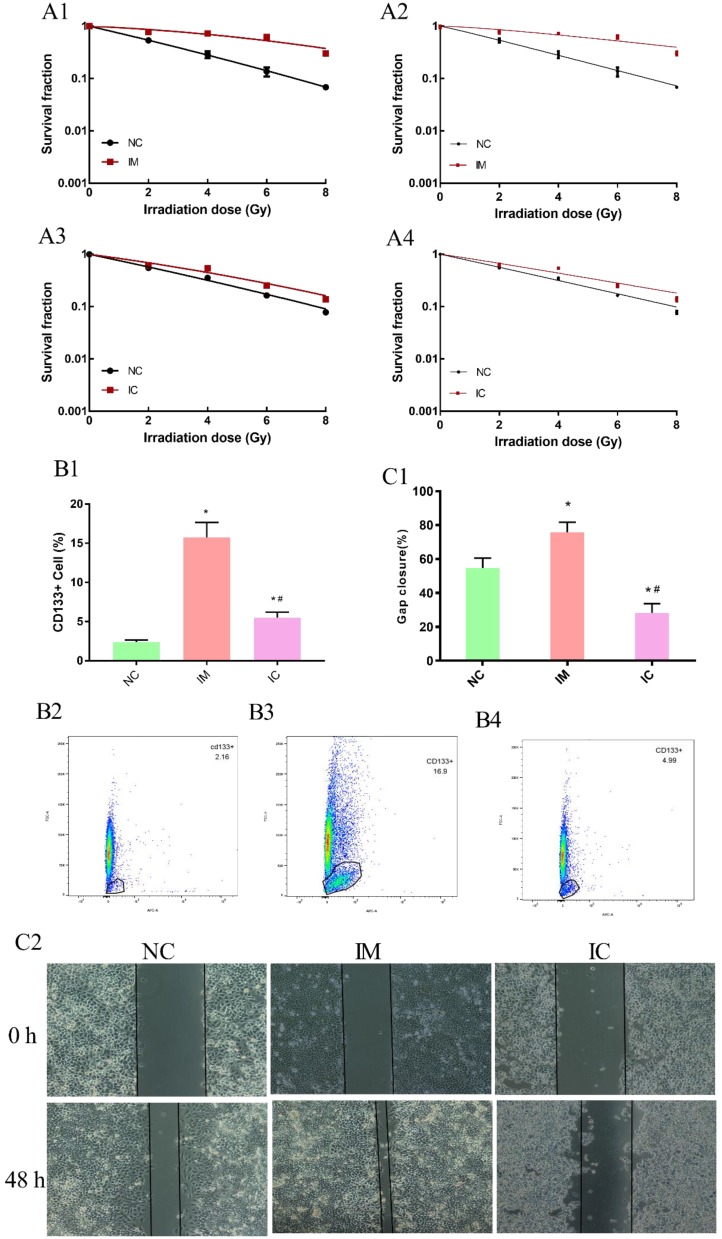
Figure 5.
Detection of cell biology changes. The dose-survival curve of NC and IM obtained from L-Q matching. (A1) The dose-survival curve of NC and IM obtained from multi-target single-hit model matching. (A2) The dose-survival curve of NC and IC obtained from L-Q matching. (A3) The dose-survival curve of NC and IC obtained from multi-target single-hit model matching. (A4) The amount of CD133+ cells in three groups. (B1-4) Compared to NC group: *p < 0.05, and compared to IM group: #p < 0.05. Wound healing assay among the three groups. (C2) Gap closure (%) in each group. Compared to NC group: *p < 0.05, and compared to IM group: #p < 0.05. (C1)

