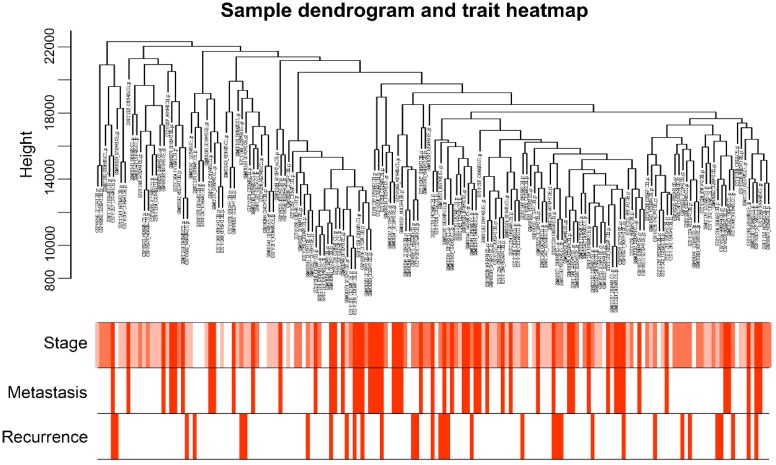
Figure 2.
Sample dendrogram and the heatmap of trait indicators. The clustering was based on the expression data of GSE41258. The top 5,000 genes with the highest SD values were used for the analysis by WGCNA. The color intensity was proportional to tumor stage, metastasis and recurrence. WGCNA, weighted gene co-expression network analysis.

