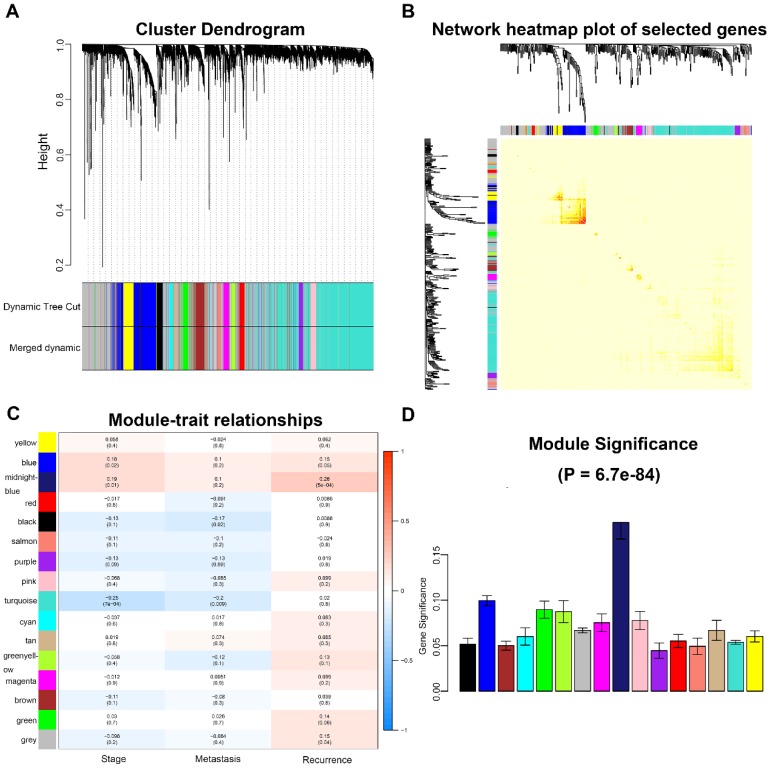
Figure 4.
Identification of modules associated with the clinical traits of CRC. a Clustering dendrogram of genes based on a dissimilarity measure (1-TOM). b Topological overlap matrix plot. Genes in the rows and columns are sorted by the clustering tree. Different colors of horizontal axis and vertical axis represent different modules. The brightness of yellow in the middle represents the degree of connectivity of different modules. c Heatmap of the correlation between module eigengenes and clinical traits of CRC. d Distribution of average gene significance and errors in the modules associated with recurrence of CRC. CRC, colorectal cancer; TOM, topological overlap matrix.

