Figure 5.
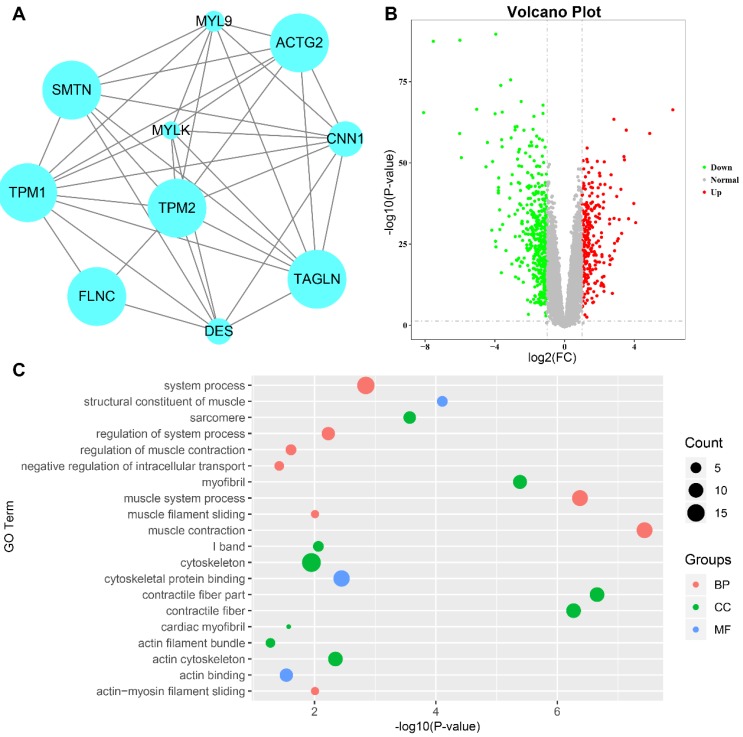
Identification of hub genes and GO analysis. a Protein-protein interaction network of the hub nodes. Nodes represent genes, and node size is correlated with connectivity of the gene by degree. b Volcano plot visualizing DEGs in GSE41258. The red dots represent all the up-regulated genes, the green dots represent all the down-regulated genes. c GO functional annotation genes in the midnightblue module. The x-axis represents the -log(P-value) of each term and the y-axis represents the GO terms. The size of the nodes is proportional to the number of genes. The red, green and blue color of the nodes represents biological process (BP), cellular component (CC) and molecular function (MF), respectively. GO, gene ontology; DEGs, differentially expressed genes.

