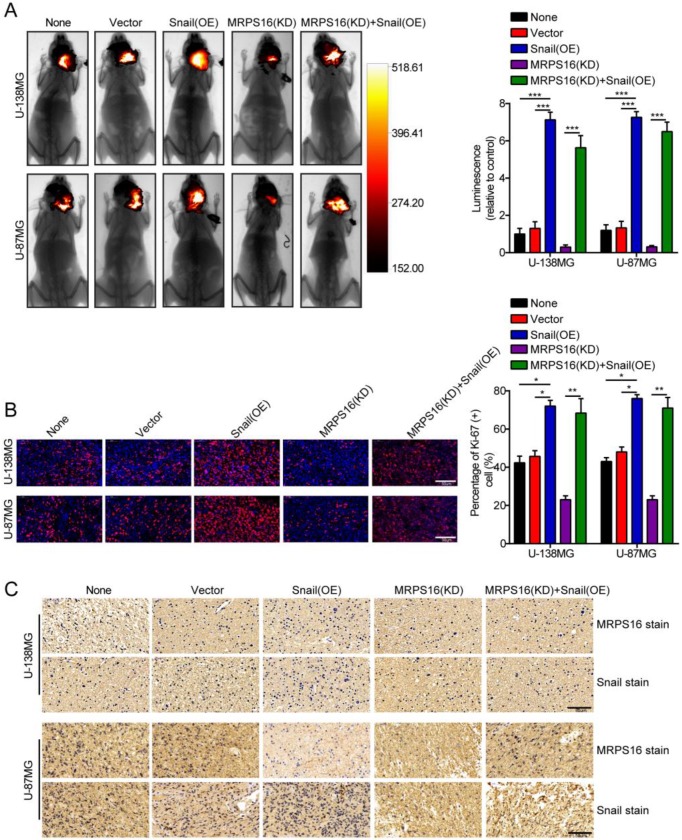
Figure 6.
MRPS16 knockdown inhibits tumor growth. A. Representative images of the brain orthotopic tumor by U-138MG/Luc and U-87MG/Luc cells injected into the brain parenchyma of nude mice (left panels) and histogram analysis of luminescence representing the size of the tumors measured after four weeks (right panels). n = 5. B. Representative images (left panels) of IF staining with Ki-67 and histogram analysis of the percentage of Ki-67 (+) cells (right panels). C. Representative images of IHC staining with MRPS16 and Snail. Statistical significance was assessed using one-way ANOVA followed by Dunnett's tests for multiple comparisons. Scale bars: 50μm. *P < 0.05, **P < 0.01 and ***P < 0.001. None: non infected cells.

