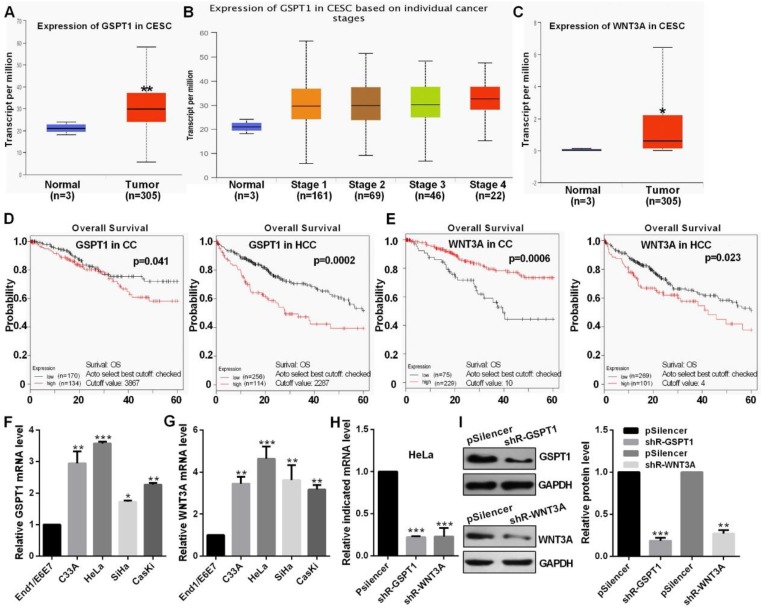
Figure 5.
The level of GSPT1 and WNT3A in CC. (A and B) TCGA database showed the level of GSPT1 in CC. (C) TCGA database showed the level of WNT3A in CC. (D and E) Kaplan Meier plotter software showed the overall survival of patients with high or low expression of GSPT1 or WNT3A. (F and G) GSPT1 or WNT3A mRNA expression levels in CC cells were measured by RT-qPCR. (H) Efficiency of shR-GSPT1 and shR-WNT3A were identified by RT-qPCR. (I) Efficiency of shR-GSPT1 and shR-WNT3A were identified by western blot. Experiments were performed 3 times, and data are presented as means ± SD.*P<0.05; **P<0.01; ***P<0.001; ns, not significant.

