
Fig. 2.
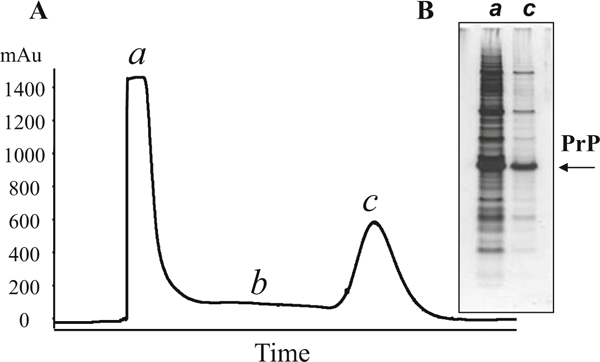
Leakage of proteins from the IMAC column. (a) IMAC profile. Overloading of IMAC column results in higher than normal UV values of unbound proteins (>1400 mAu, stage a) and subsequent baseline higher than 100 mAu (stage b). The height of the PrP peak remains at typical level of 600 mAu (stage c). (a) Analysis of IMAC fractions in SDS-PAGE (10% bis-tris) confirms the presence of high amount of PrP in the flow through (lane a)