
Figure 2. Agglomerative hierarchical cluster analysis of all data collected for the third time point.
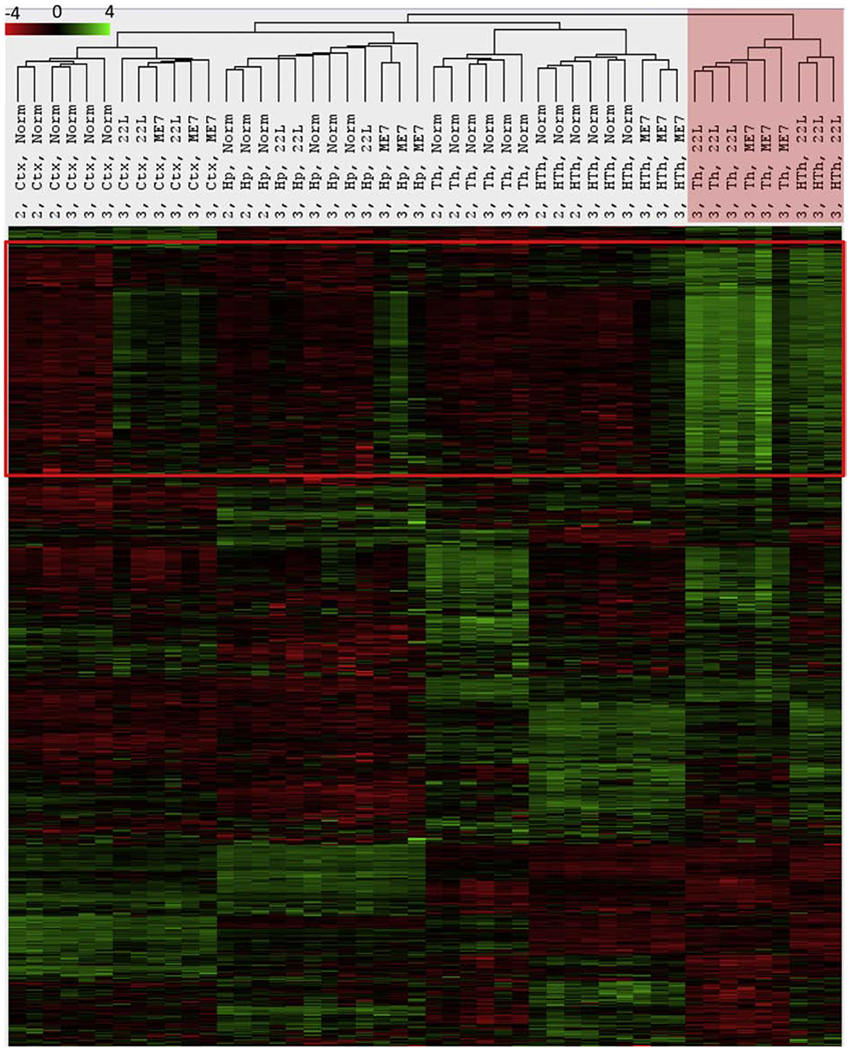
The red frame define genes forming the neuroinflammatory signature. 22L Th, 22L HTh and ME7 Th clustered away from all other samples as indicated by red shading. This separation is driven by a strong upregulation of genes within the neuroinflammatory signature block. Notably, 22L Ctx and ME7 Ctx, Hp and HTh also show upregulation of the same genes, which separates these samples from normal controls within the corresponding regional clusters.