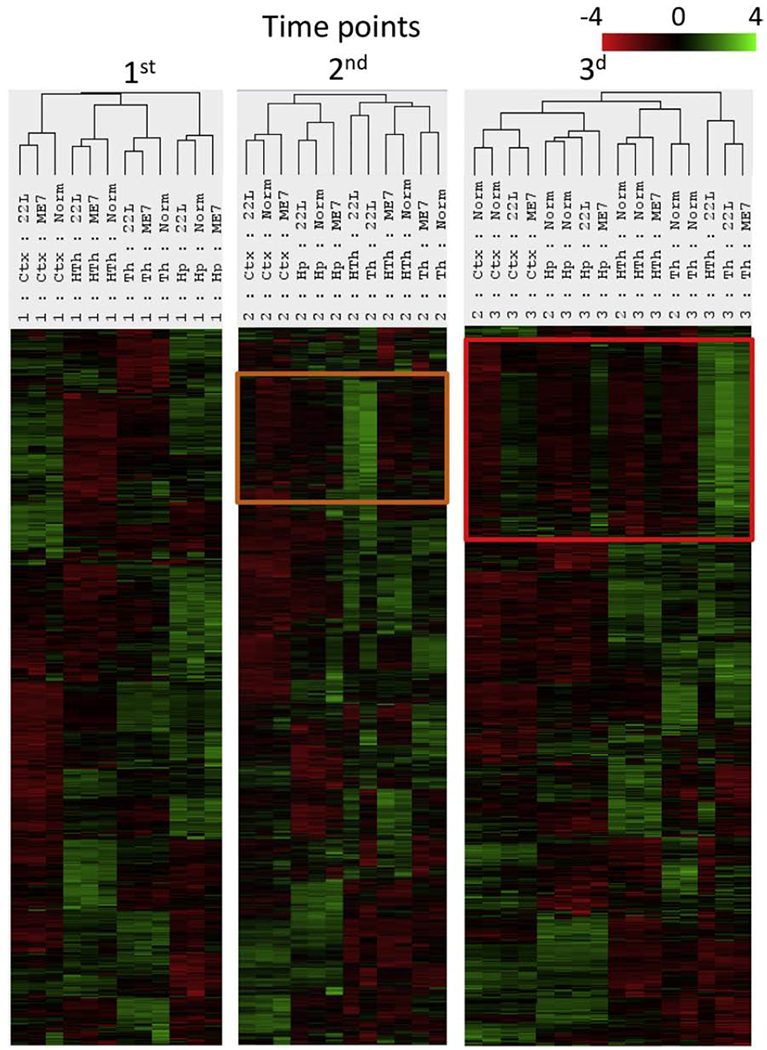
Figure 3. Agglomerative clustering analysis of grouped samples collected for all three time points.

To group samples, the geometric mean of expression levels for all samples from each group (n=3) were calculated. The set of genes upregulated at the second time point (orange frame) expands further at third time point (red frame).
