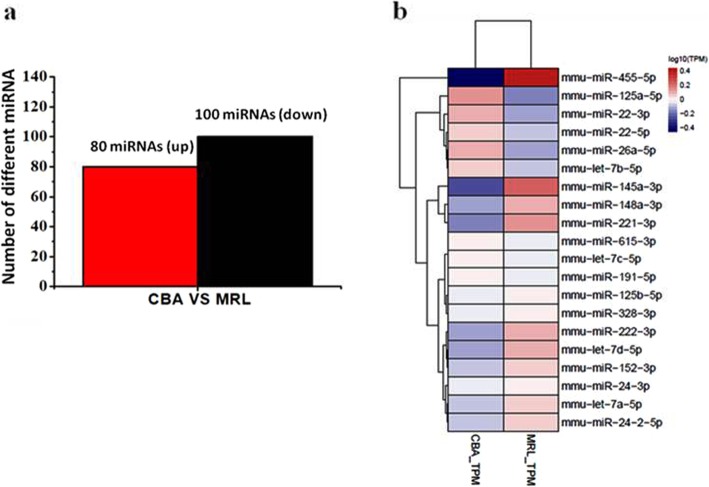
Fig. 5.
The miRNA differential expression profiles in EVs. a The histogram showed the differentially expressed miRNAs in CBA-EVs and MRL-EVs. Compared with CBA-EVs, the red histogram represent upregulation for the MRL-EVs, and the black histogram represent downregulation of expression for the MRL-EVs. b The heatmap of top 20 differentially expressed miRNAs in CBA-EVs and MRL-EVs based on miRNA sequence analysis

