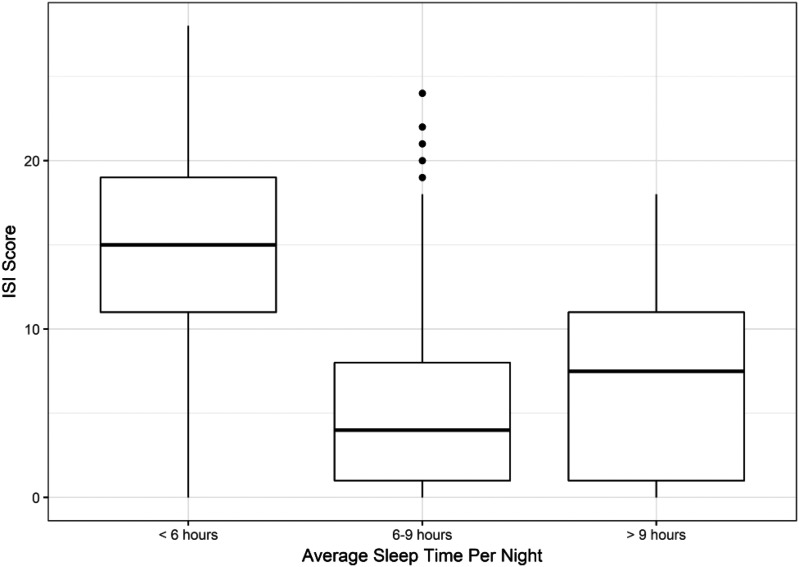
Figure 2. Severity of insomnia symptoms according to sleep duration.
The thick bar represents the median Insomnia Severity Index score within each category of sleep duration. The ends of the boxes represent the first and third quartiles. The vertical lines represent values that are 1.5 times the interquartile range from each quartile or the min/max if inside 1.5 interquartile range. The small circles represent outliers (more than 1.5 times the interquartile range from a quartile). Higher scores indicate greater symptoms. Scores ≥ 15 indicates moderate – severe insomnia symptoms.

