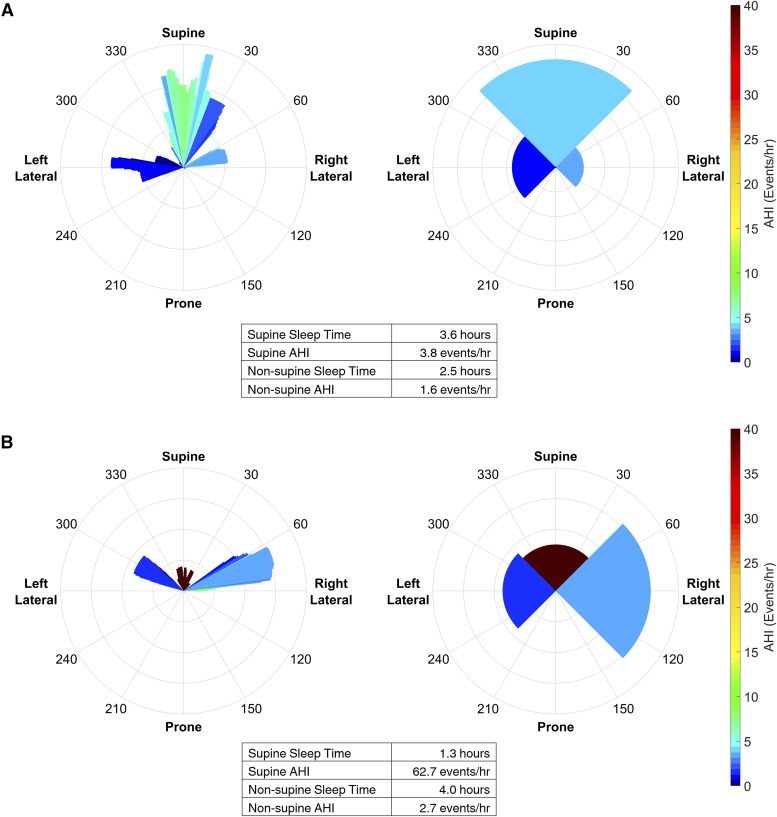
Figure 9. Adaption of the visualization for discrete posture data from a traditional sensor.
The visualization can also be applied to discretized posture data (ie, as available from conventional posture sensors) by simply dividing the circular histogram into four quadrants. (A) The visualization for the participant in Figure 6 using both the novel and discretized posture data. In this individual, the extra information from the high resolution sensor changes the interpretation of the posture dependent apnea severity. In the high resolution figure the patient has a supine AHI between 6–10 events/h (ie, mild OSA) when sleeping within approximately ± 10 degrees of supine. However, if the posture information is discretized into four values (ie, equivalent to a traditional sensor), the supine AHI falls within the normal range (ie, below 5 events/h). (B) The visualization for the participant in Figure 5 using both the novel and discretized posture data. It is clear that this individual has supine predominant OSA in both visualizations, and it is unlikely that utilizing the high resolution sensor would impact management decisions. The visualization of the discretized data allows a quick and intuitive interpretation of the data that is conventionally presented as summary statistics.

