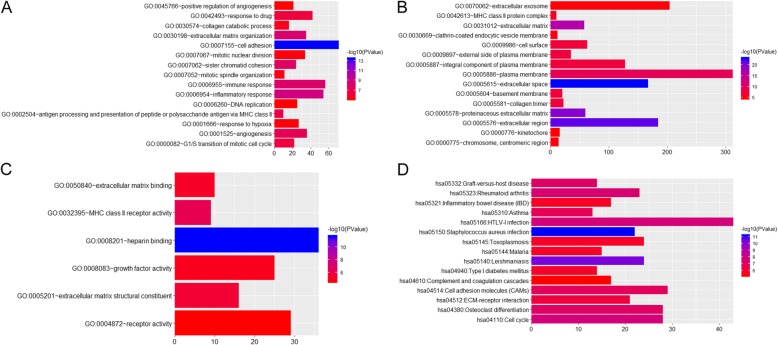
Fig. 3.
Significantly enriched GO terms and KEGG pathways of DEmRNAs between OA and normal controls. a. BP, biological process; b. CC, cellular component; c. MF, molecular function; d KEGG pathways. The x-axis shows counts of DEmRNAs enriched in GO terms or KEGG pathways and the y-axis shows GO terms or KEGG pathways. The color scale represented -lg p-value

