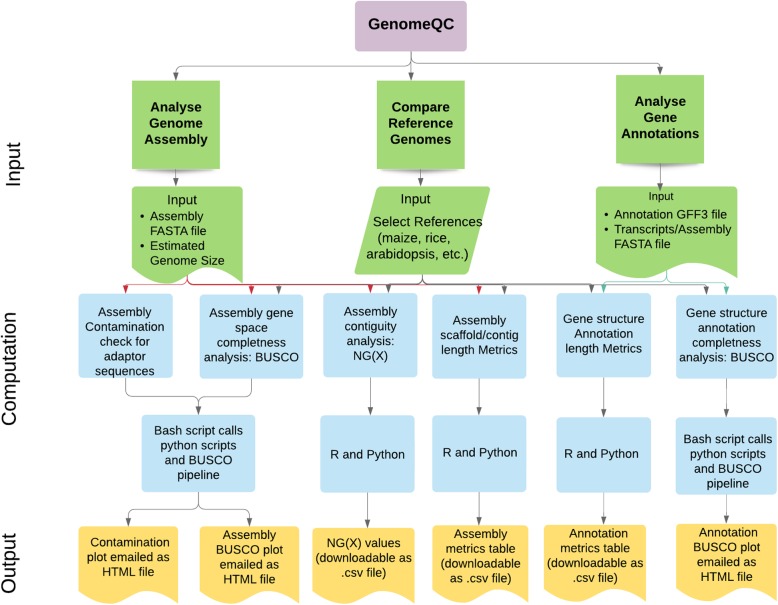
Fig. 1.
Workflow of the web application. The interface layer of the web application is partitioned into 3 sections: comparing reference genomes, analyzing genome assembly and analyzing gene structure annotations (green). Each of these sections has an input widget panel for file uploads and parameter selection (green). The input parameters and the uploaded data files are then analyzed for contiguity, gene space and repeat space completeness, and contamination check (blue) using bash, R and python scripts (blue) and the different metrics and plots are displayed through the output tabs (yellow)

