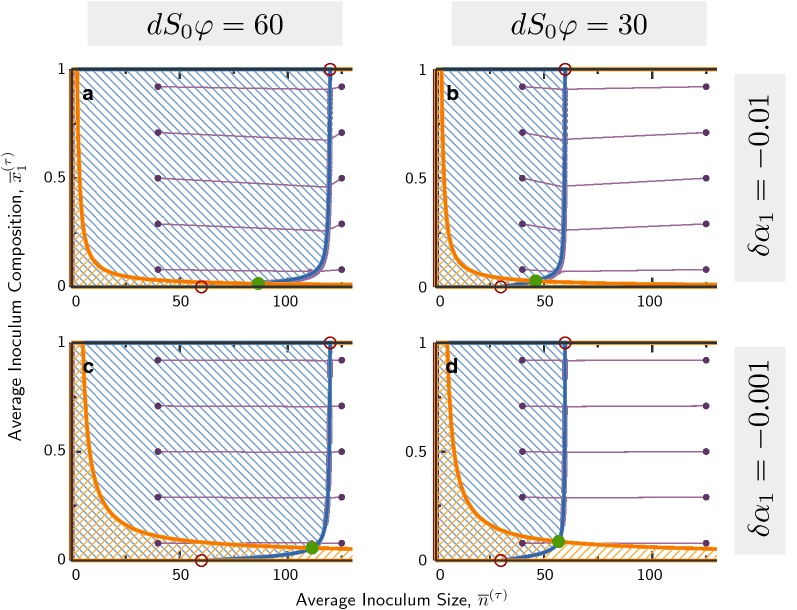
Fig. 7.
Dynamics over multiple cycles with production of pyoverdine that enhances iron-availability. Blue hatched areas indicate an increase of the average inoculum size over one cycle, while orange hatched areas indicate an increase in the population composition . Strain 1 () differs from Strain 2 () by a slower growth rate and a non-zero production of pyoverdine , . Purple dots connected by lines show exemplaric trajectories, that lead to coexistence fixed points for the chosen parameters. Only the first 50 cycles from each trajectory are shown. Adjustment of the average inoculum size is fast, while the population composition changes slow. Growth rate differences are chosen to be (a, b) and (c, d). Dilution rates (indicated by average inoculum sizes for growing populations) are (a, c) and (b, d). Other parameters are and for all panels

