
Figure 7.
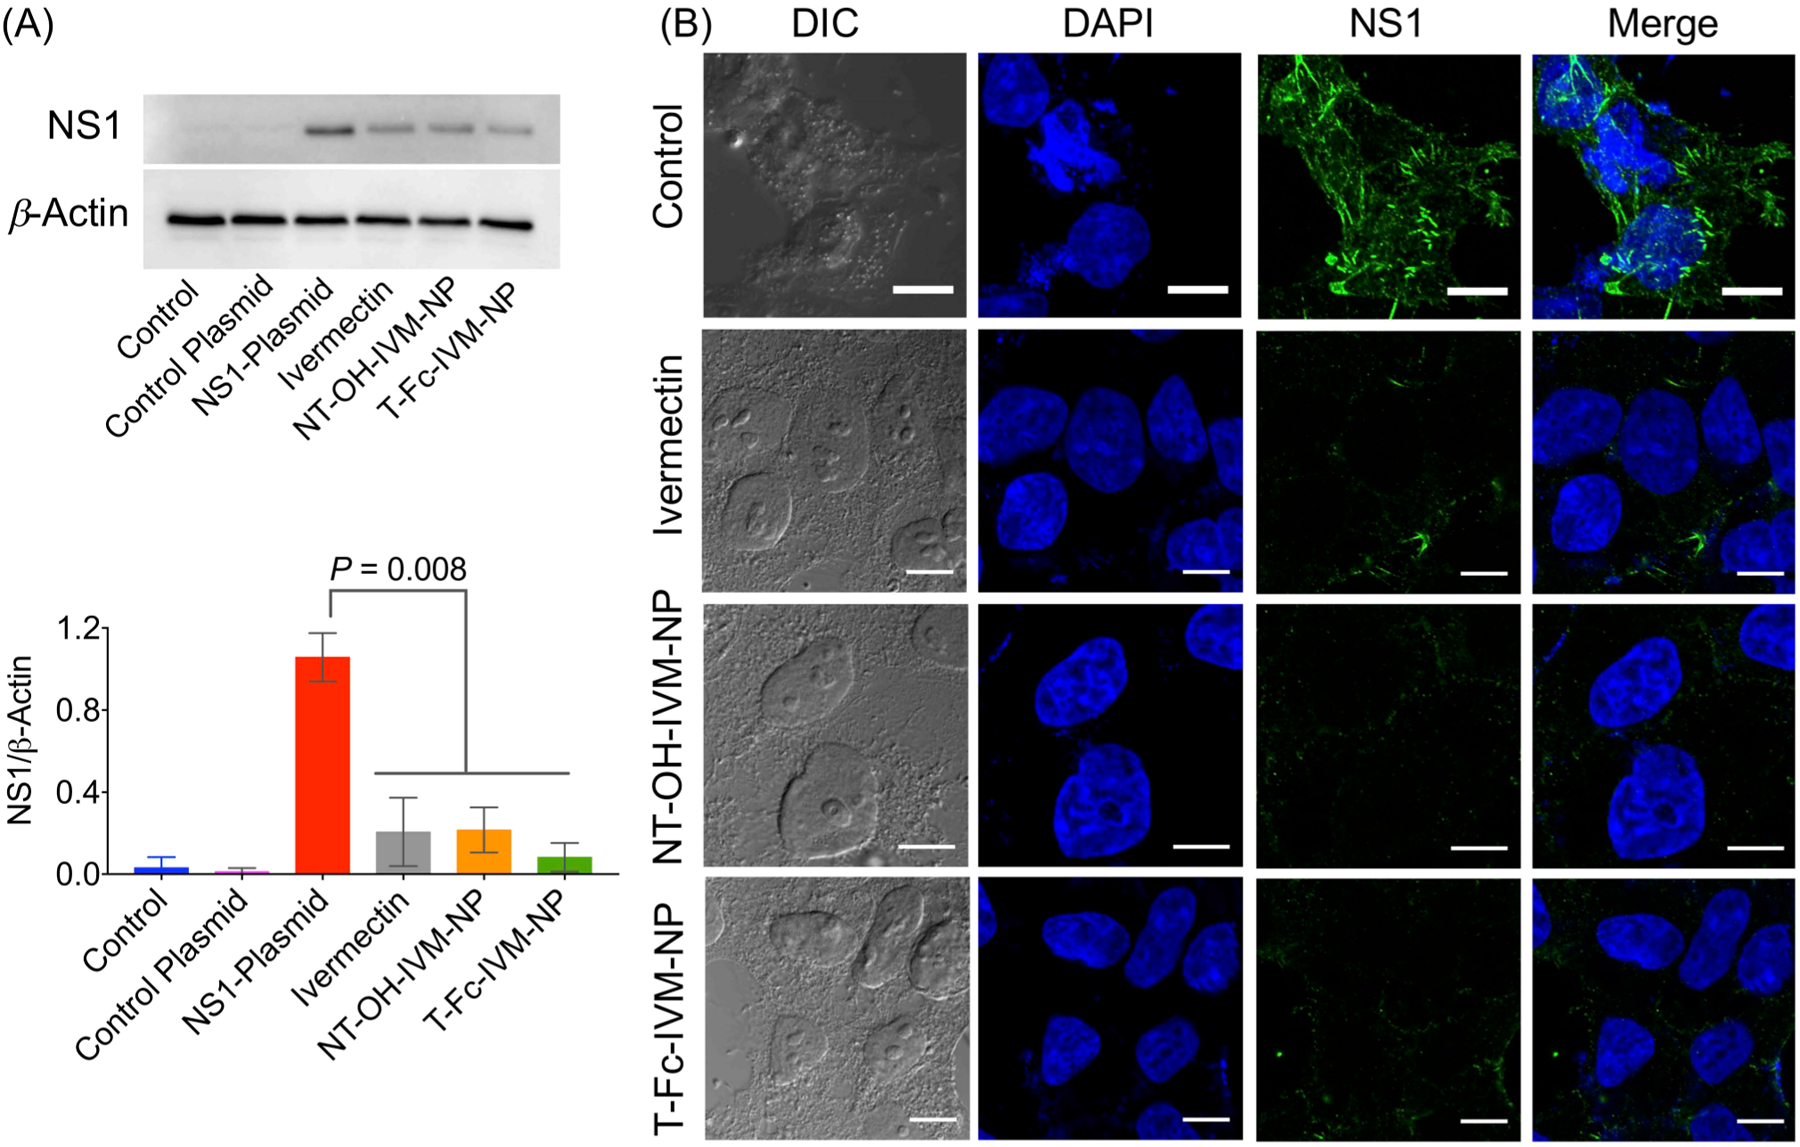
NS1 expression level in HEK293T cells after treatment with NPs by (A) Western blotting and (B) immunofluorescence. Cells were treated with IVM, NT-OH-IVM-NP, or T-Fc-IVM-NP at a concentration of 10 μM with respect to IVM for 6 h. Scale bar: 10 μm. Statistical analyses were performed by two-way ANOVA analysis with multiple comparisons.