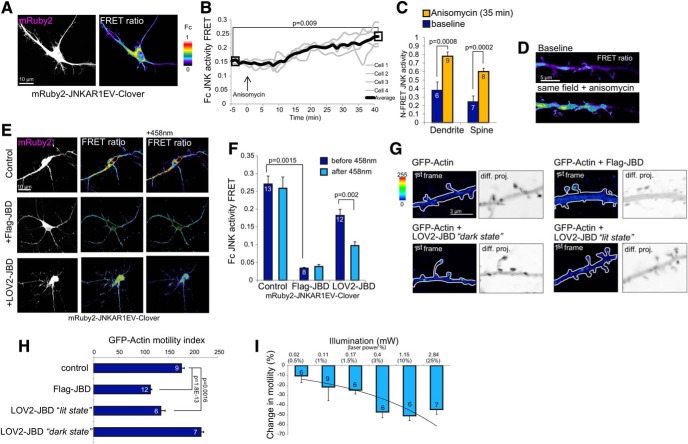
Figure 2.
Photoactivation of LOV2-JBD reduces actin dynamics in dendritic spines. A, Hippocampal neurons expressing mRuby2-JNKAR1EV-Clover FRET reporter provide a real-time readout of JNK activity. The mRuby2 image (left) indicates reporter expression and FRET image (right) indicates JNK activity, which is high in the cytoplasmic compartment. The look up table (LUT) shows FRET ratios (Fc) from 0 to 1. B, mRuby2-JNKAR1EV-Clover FRET reporter activity from hippocampal neuron dendrites increases following JNK activation following anisomycin (10 μM) treatment. C, N-FRET shows that JNK is activated in dendrites and spines 40 min following anisomycin (10 μM). Mean data ± SEM are shown; p values are from Student’s t test. Extended Data Figure 2-1 shows mRuby2-JNKAR1EV-Clover FRET has improved dynamic range compared to YPET-JNKAR1EV-CFP. D, Representative image of mRuby2-JNKAR1EV-Clover FRET in dendritic spines. E, FRET images from live cell analysis indicate Flag-JBD inhibits JNK, as does LOV2-JBD following photostimulation for 30 s with 0.4 mW of 458-nm laser. F, Corrected FRET (Fc) from multiple experiments as described in E. Measurements were from five regions of interest per cell, from four cells from at least two experimental repeats. Mean data ± SEM are shown. Adjusted p values are shown from repeated measures one-way ANOVA with Bonferroni correction. Extended Data Figure 2-2 shows independent readout of JNK activity changed due to excitation of the FRET probe with 488-nm laser. G, GFP-actin displacement is shown in arithmetic difference projections (diff. proj.) depicting summed GFP-actin displacements from 11-min imaging. Darker pixels represent higher motility. Scale bar = 3 μm. H, Calculated motility index from several recordings as described in G. Flag-JBD and LOV2-JBD lit-state mutants significantly reduce spine motility. Mean data ± SEM are shown. Adjusted p values are shown from repeated measures one-way ANOVA with Bonferroni correction I, The minimal illumination required to photoactivate LOV2-JBD is shown. Motility changes from neurons expressing mCherry-actin plus LOV2-JBD and exposed to increasing 458-nm illlumination are shown; 0.4 mW (achieved using 3% laser power) was the minimum irradiance needed to elicit a maximal response. Motility was calculated from four to six spines per cell and two to three cells per condition from at least two experimental repeats.

