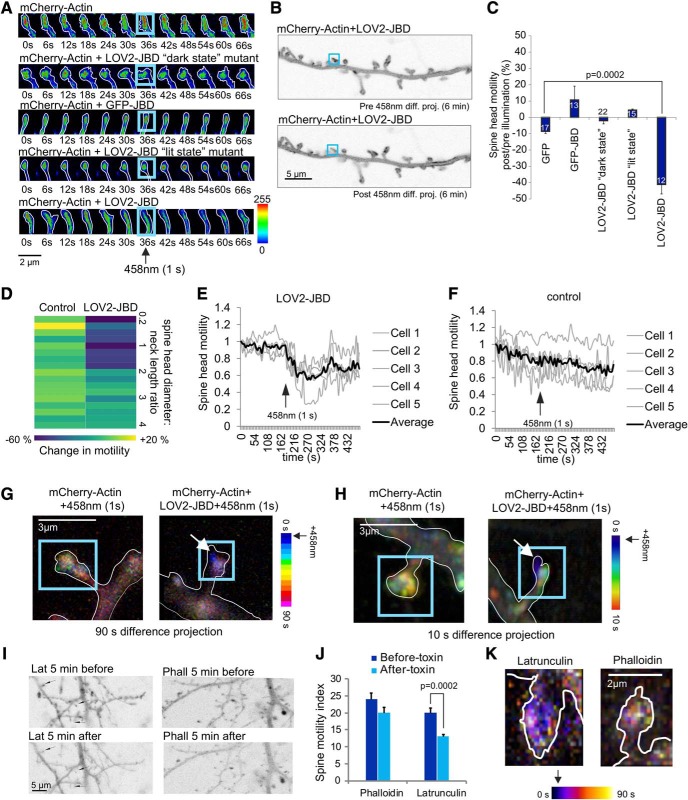
Figure 3.
Photoactivation of the LOV2-JBD inhibitor rapidly reduces actin motility in the peripheral domain of the spine. A, Time-lapse sequences from 16-d hippocampal neurons expressing mCherry-actin and LOV2-JBD variants. ROIs (blue squares) encompassing spine-heads were photostimulated for 1 s at 36 s using 0.4 mW of 458-nm light. Spine-head motility was reduced following light only in cells expressing LOV2-JBD. Additional examples are in Extended Data Figure 3-1A. B, Arithmetic difference projections of mCherry-actin before (pre) and after (post) 458-nm illumination of the spine (blue box). LOV2-JBD immobilized mCherry-actin in photoactivated spines only. Dendritic shaft mCherry-actin was unchanged. C, Quantitative data on mCherry actin motility. Mean data ± SEM are shown. Spine numbers are indicated on the bars. D, mCherry-actin motility changes are plotted according to spine head diameter:neck length ratio. Data from spines with head diameter:neck length ratios corresponding to “mushroom” spines is in Extended Data Figure 3-1B. E, Time-lapse of spine-head mCherry-actin motility shows LOV2-JBD immobilizes actin motility within 6 s of photoactivation. F, Light alone does not alter actin dynamics. For E-F, more than or equal to four spines were measured per cell. G, Color-coded time projections provide spatial information on mCherry-actin motility over 90-s recording. Photoactivation is at 0 s. Images are acquired at 6-s intervals and coded with a unique hue (LUT). Mixed color (white-ish) indicates continued motility over time. Blue indicates no further movement after that time point. LOV2-JBD-expressing neurons display reduced motility following light. H, Higher resolution maximum projections of temporally color-coded dendritic spines are shown from 10-s time lapses acquired at 1-s intervals. These show mCherry-actin is immobilized in the spine periphery. Additional examples with actin footprints and movies generated from the time lapses are in Extended Data Figure 3-1C–E. I, The effect of latrunculin and phalloidin on dendritic spine motility were tested. Arithmetic projection images before and after 458-nm light indicate effect on actin dynamics. J, Quantitative data from I indicate that latrunculin reduces actin motility. Measurements are from ≥10 cells and multiple spines from separate experiments. Mean data ± SEM are shown. K, Temporal color coding of spines from neurons treated with latrunculin or phalloidin are shown.

