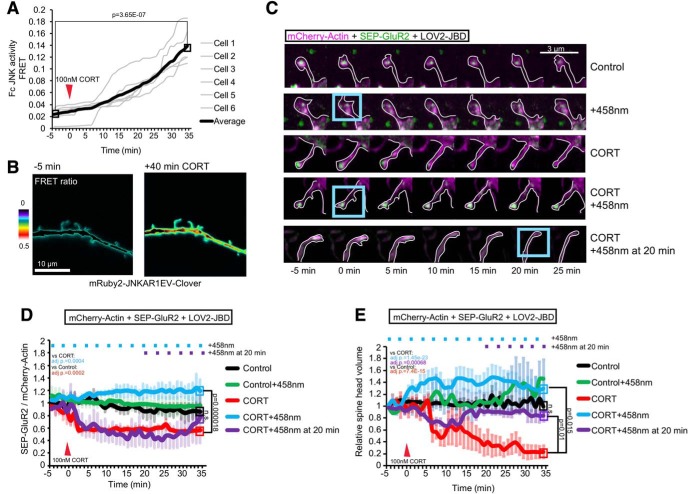
Figure 4.
Corticosterone activates JNK and induces SEP-GluR2 removal and spine regression. A, Time-lapse recording of JNK activity in dendritic spines after corticosterone (CORT) application. Normalized Fc FRET is from six cells and more than or equal to four spines per cell. B, Representative FRET ratio images from mRuby2-JNKAR1EV-Clover expressing cells. C, Representative images of time-lapse sequences (D, E) from 16-d hippocampal neurons expressing mCherry-actin (magenta), SEP-GluR2 (green), and LOV2-JBD. Cells were treated with CORT (100 nM) at 0 min, and LOV2-JBD was photoactivated using 458-nm 1-s light pulses (using 3% laser power, LSM-880 Airyscan) applied to ROI (blue boxes) at 3-min intervals where indicated (+458 nm), or in lower panels, after a 20 min delay. SEP-GluR2 was imaged using the 488-nm laser (0.8% laser power with LSM-880 Airyscan), to minimize cross-activation of LOV2-JBD. D, Quantitative data on cell surface SEP-GluR2 fluorescence is from eight experiments as depicted in C. E, Estimated spine-head volume is normalized to baseline volume, averaged over 3 min before treatment. Extended Data Figure 4-1 shows experiments repeated as in C–E with CORT treatment using YFP as an inert filler instead of mCherry-actin. Quantitative data are calculated from eight experiments. Mean data ± SEM are shown. Adjusted p values comparing full timelines are from repeated measures one-way ANOVA with Bonferroni correction.

