Figure 5.
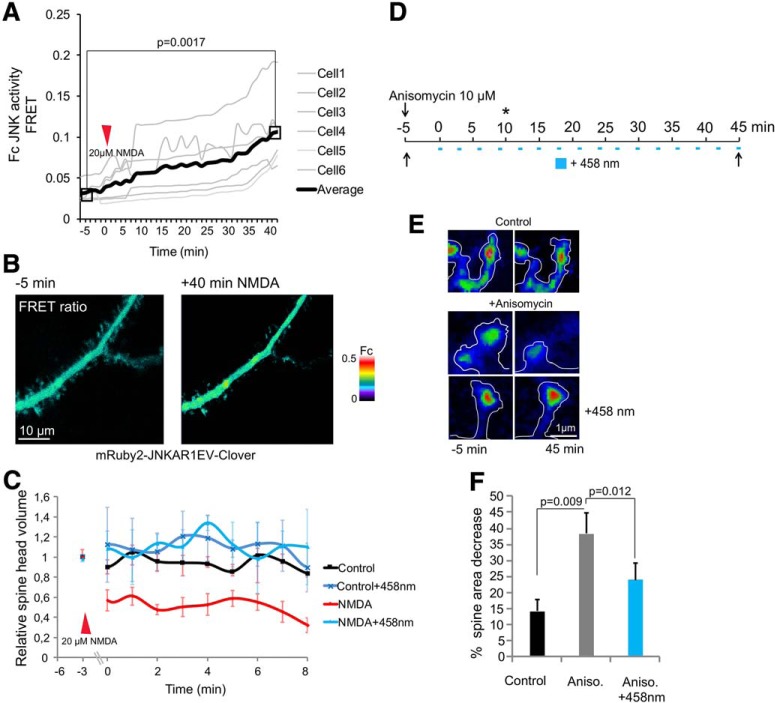
NMDA activates spine-head JNK and induces retraction. A, Time lapse of JNK activity from mRuby2-JNKAR-1EV-Clover FRET reporter. ROI FRET (Fc) was measured from spines of 16-d hippocampal neurons before and after NMDA (20 μM). B, Representative FRET images before and after NMDA. C, The estimated spine-head volume from neurons expressing mCherry-actin and LOV2-JBD before (–3 min) or after treatment with NMDA are shown. Continuous photoactivation of LOV2-JBD was achieved using 1-s pulses of 458-nm laser (3% power) at 3-min intervals. LOV2-JBD photoactivation prevented NMDA-induced spine retraction. D, The experimental setup for anisomycin (10 μM) treatment and photoactivation timeline is shown. The “*” indicates time point at which JNK was activated. E, Neurons were treated with or without anisomycin and spine volume measured at 45 min (as described in D). Anisomycin induced spine retraction which was prevented by LOV2-JBD photoactivation. F, Mean data ± SEM from 20–24 spines/treatment is shown. Adjusted p values comparing full timelines are shown from repeated measures one-way ANOVA with Bonferroni correction.

