
Figure 3a:
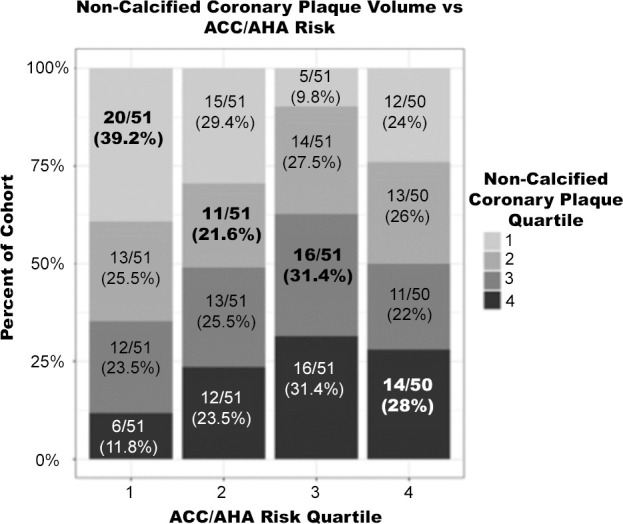
Percentage of cohort per imaging quartile risk compared with American College of Cardiology/American Heart Association (ACC/AHA) risk quartile. Bolded values represent matched quartiles. (a) Noncalcified coronary plaque volume versus ACC/AHA risk. (b) Average carotid wall volume versus ACC/AHA risk. (c) Coronary artery calcium score versus ACC/AHA risk.