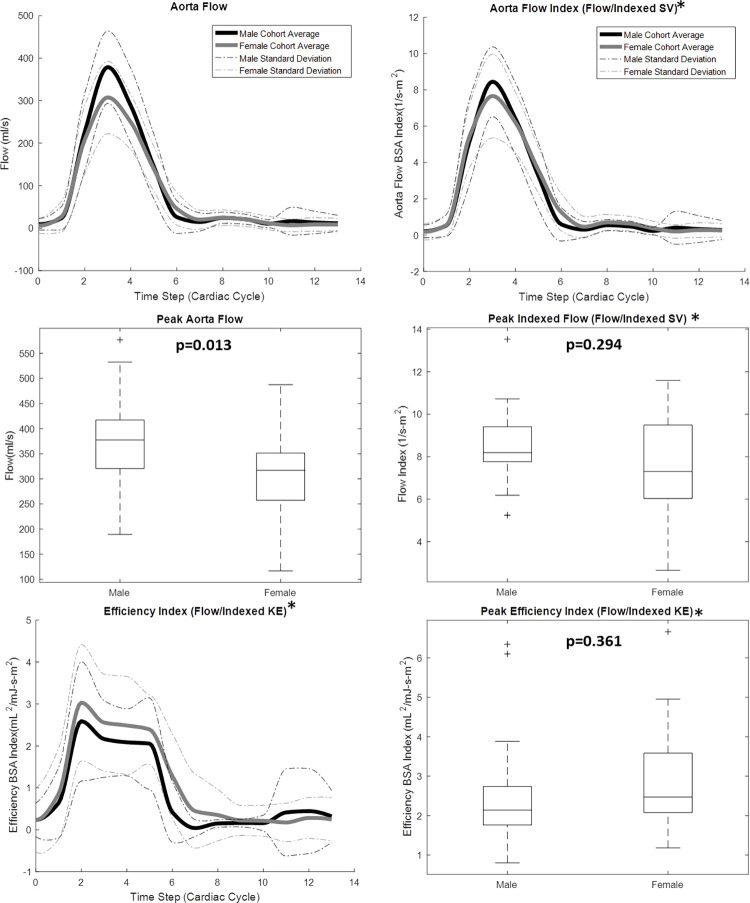
Figure 3:
Four-dimensional flow MRI data were used to calculate aorta flow throughout the cardiac cycle for 20 healthy men and 19 healthy women. Cardiac function data from two-dimensional short-axis MR images were used, in conjunction with body surface areas (BSAs), to create an aorta flow index parameter. *Indexed data were reported on 35 of the 39 volunteers: BSA was not recorded for four participants. Lines in box plots represent median values. KE = kinetic energy, SV = stroke volume.

