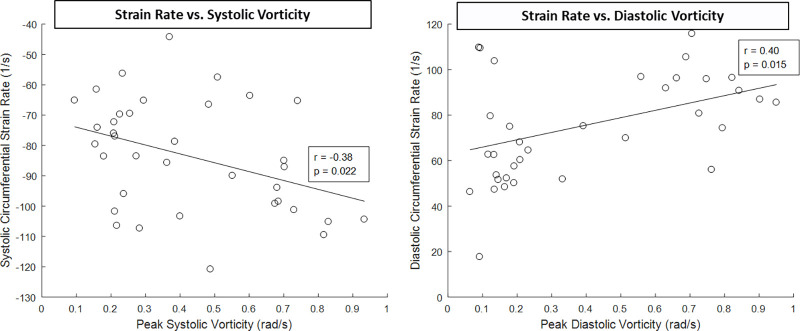
Figure 7:
Left ventricle (LV) strain rates obtained from two-dimensional cine images were compared with LV blood flow kinetic energy derived from four-dimensional flow MRI data. A moderate relationship was observed in both systolic and diastolic phases of the cardiac cycle. Note that increased strain is correlated with increased vorticity in both systole (negative strain) and diastole (positive strain). The sign (positive vs negative) of the strain metrics in systole and diastole is opposite to maintain consistency of wall motion with the designated coordinate direction (wall moving inward in systole and outward in diastole).

