Figure 4.
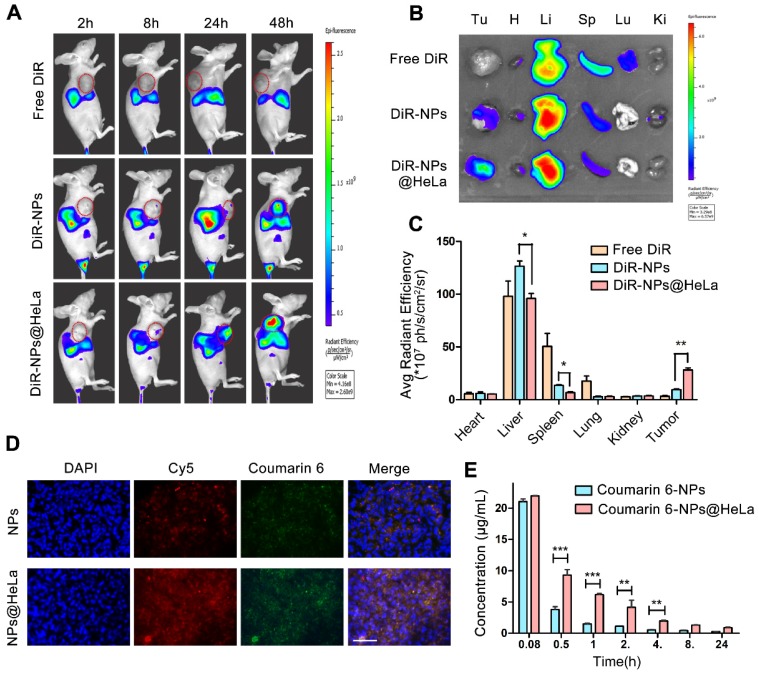
Biodistribution and pharmacokinetics of NPs and NPs@HeLa. (A) Whole body fluorescence images of HeLa subcutaneous xenograft mice at 2, 8, 24, and 48 h after injection of free DiR, DiR-NPs, and DiR-NPs@HeLa (at DiR dose of 0.4 mg/kg). The tumor area is circled in red. (B) Representative ex vivo images of tumor (Tu), heart (H), liver (Li), spleen (Sp), lung (Lu), and kidney (Ki) at 48 h post-injection of free DiR, DiR-NPs or DiR-NPs@HeLa. (C) The corresponding average radiation efficiency of resected tumors and major organs. (D) Representative fluorescence microscopy images of tumor cryosections 24 h after intravenous injection with dual-labeled NPs or NPs@HeLa. The nucleus was stained with DAPI (blue); Coumarin-6 (green), representing the location of PTX, and siRNA labeled by Cy5 (red) were co-loaded into the nanoparticles. Scale bar, 100 µm. (E) Blood circulation of Coumarin-6 loaded NPs and NPs@HeLa. Data are given as the mean ± SD (n = 3 mice per group). *p < 0.05, **p < 0.01, ***p <0.001.

