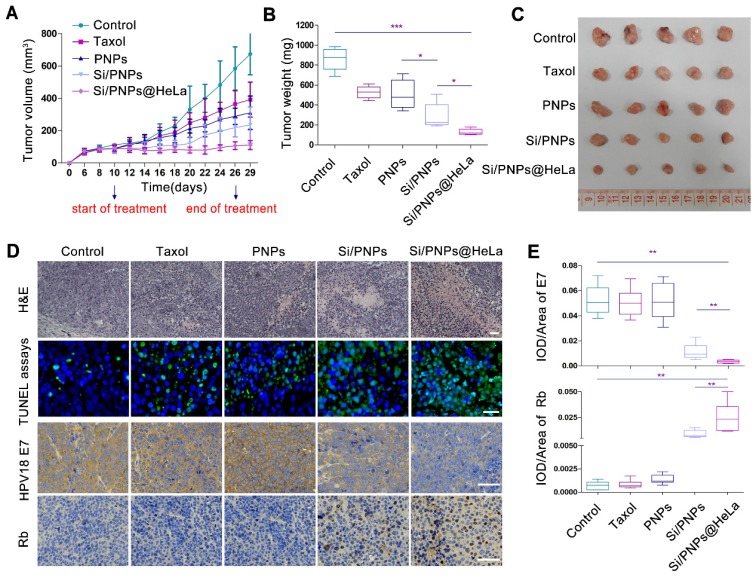
Figure 5.
In vivo antitumor effects. (A) Tumor growth profiles of HeLa tumor-bearing mice receiving intravenous injections of different formulations every 2 days, for 9 injections, at a fixed PTX dose (6 mg/kg) and siRNA dose (2 mg/kg). Tumor weight (B) and photographs of the collected tumor tissues (C) on day 29. (D) Representative images of H&E staining (up, scale bar, 60 µm) and TUNEL assays (middle, scale bar, 25 µm) of tumor tissue; immunohistochemical analysis of the expression of HPV18 E7 and Rb (down, scale bar, 60 µm) in tumor sites. (E) Statistical data of HPV18 E7 and Rb expression using the optical staining intensities by ImagePro Plus (version 6.0). Data are given as the mean ± SD (n = 5 mice per group). *p < 0.05, **p < 0.01, ***p <0.001.

