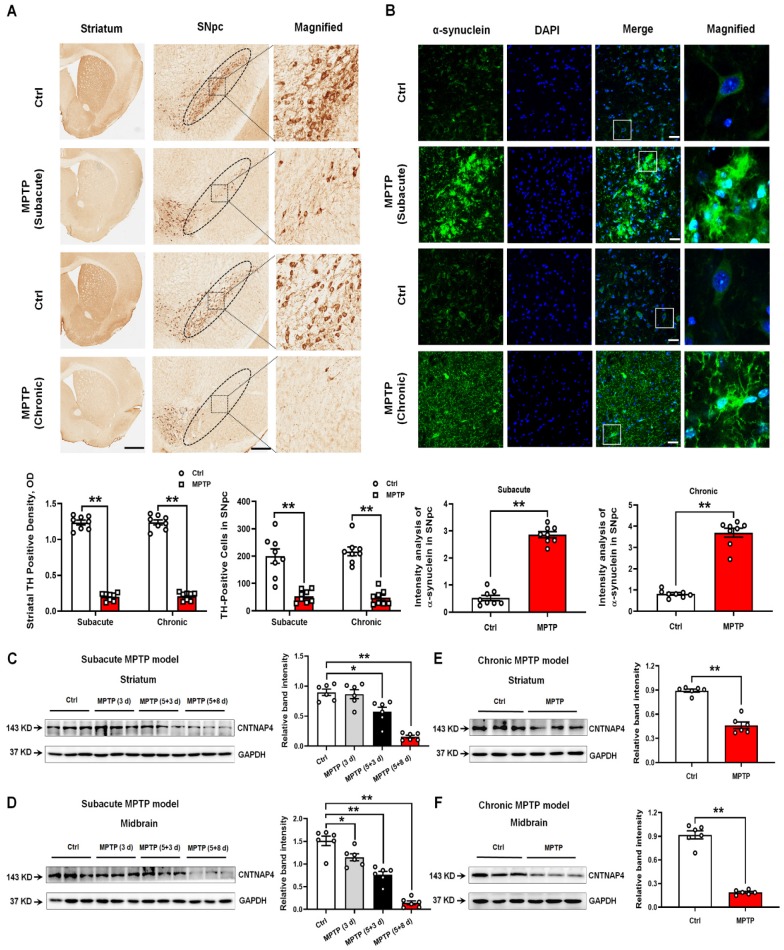
Figure 1.
Expression patterns of TH, α-synuclein, and CNTNAP in the SNpc and striatum of subacute and chronic MPTP mouse models. (A) Immunohistochemical staining of TH-positive cells in the striatum and SNpc in subacute and chronic MPTP mouse models. Magnified TH-positive cells in the SNpc are shown in the right column of panel A (scale bars, 1 mm in the striatum and 100 µm in the SNpc). The ellipses in the middle column of panel A denote the boundaries of the SNpc and the middle-column boxes denote the areas that are expanded in the right-hand columns in panel A. Quantification of striatal TH-positive density and TH-positive cells in the SNpc was shown as below panel A. (B) Immunofluorescent staining of α-synuclein-positive cells in the SNpc in subacute and chronic MPTP mouse models. Magnified α-synuclein-positive cells in the SNpc are shown in the right column of panel B (scale bars, 25 µm). Quantification of α-synuclein expression in the SNpc is shown at the bottom of panel B. (C and D) CNTNAP4 expression levels in the striatum and midbrain at different time points upon subacute MPTP administration (3 d, 5+3 d, and 5+8 d), as described in the Materials and Methods, was determined by Western blotting (n = 6 per group). (E and F) CNTNAP4 expression in the striatum and midbrain in the chronic MPTP model was determined by Western blotting (n = 6 per group). Results are expressed as the mean ± SEM. **p < 0.01, *p < 0.05 vs. control group. Statistical significance was determined by Student's t-tests for A, B, E and F, and by one-way ANOVAs for C and D.

