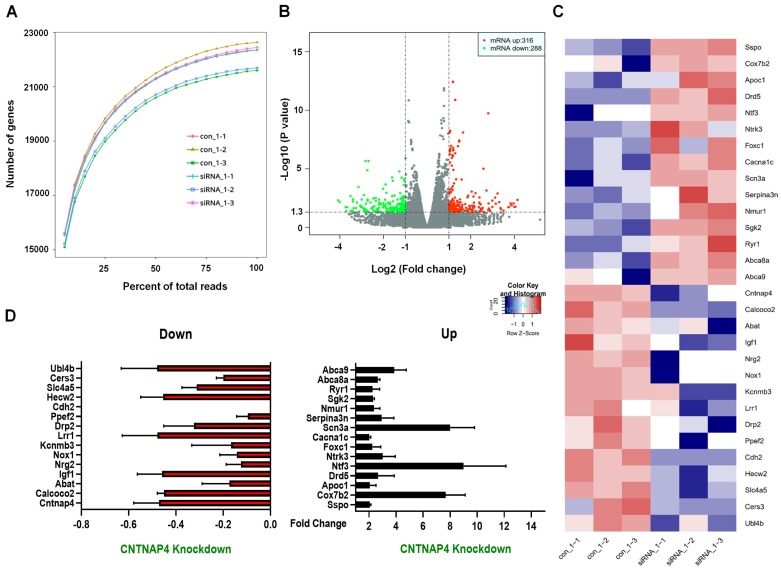
Figure 4.
Transcriptomic profiles following CNTNAP4 knockdown in MN9D cells. (A) Sequencing saturation results for Ctrl group and CNTNAP4 siRNA group are shown. (B) DEGs are shown as a volcano plot. (C) Heatmap of DEGs in Ctrl group and CNTNAP4 siRNA group. (D) Upregulated and downregulated DEGs upon CNTNAP4 knockdown in MN9D cells are shown. Note that CNTNAP4 knockdown decreased CNTNAP4 and calcoco2 expression levels in MN9D cells. Genes with an adjusted p < 0.05 and absolute values of log2(Fold Change) > 1 found by DESeq2 were assigned as being differentially expressed.

