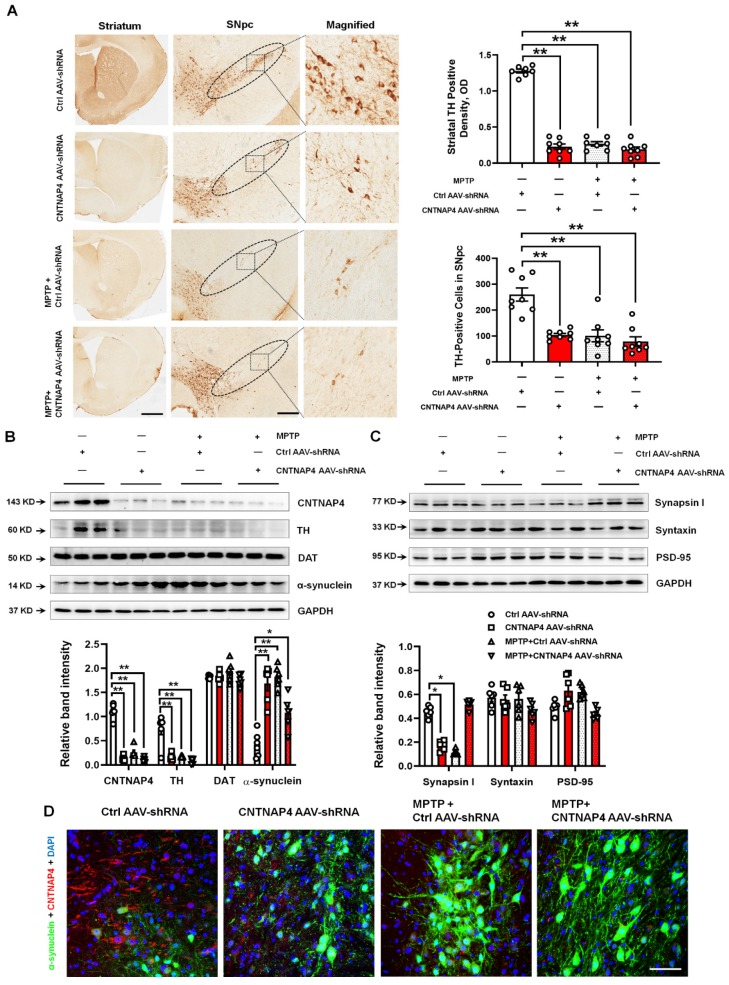
Figure 8.
CNTNAP4 knockdown in SNpc DA neurons induces DA neuronal degeneration and increased α-synuclein expression in mice. (A) Immunohistochemical staining of TH-positive cells in the striatum and SNpc in control, CNTNAP4 AAV-shRNA, MPTP, and MPTP+CNTNAP4 siRNA groups (scale bars, 1 mm in striatum and 100 µm in SNpc). The ellipses in the middle column of panel A denote the boundaries of the SNpc and the middle-column boxes denote the areas that are expanded in the right-hand columns in panel A. Quantification of striatal TH-positive density and TH-positive cells in the SNpc was shown in the right of panel A. (B and C) Expression levels of CNTNAP4, TH, DAT, α-synuclein, synapsin І, syntaxin, and PSD-95 in the midbrain of control, CNTNAP4 AAV-shRNA, MPTP, and MPTP+CNTNAP4 siRNA groups were determined by Western blotting. (D) Immunofluorescent staining of CNTNAP4 and α-synuclein in the SNpc of Control, CNTNAP4 AAV-shRNA, MPTP, and MPTP+CNTNAP4 siRNA groups (scale bar, 25 µm). Western blotting results are from three of the six mice in each group and are expressed as the mean ± SEM. **p < 0.01, *p < 0.05 vs. Control group. Statistical significance was determined by one-way ANOVAs and Tukey tests for post-hoc comparisons.

