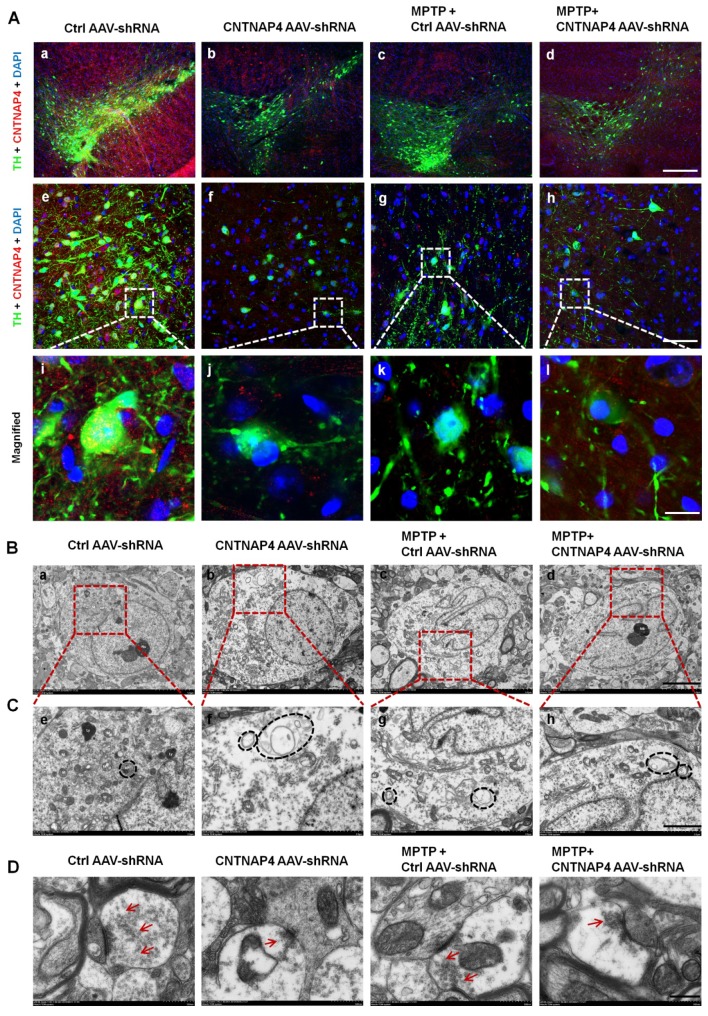
Figure 9.
CNTNAP4 knockdown in SNpc DA neurons induces ultrastructural deficits at DA synapses in the SNpc in mice. (A) Immunofluorescent staining of CNTNAP4 and TH in the SNpc of control, CNTNAP4 AAV-shRNA, MPTP, and MPTP+CNTNAP4 siRNA groups. Magnified images are expansions of boxed areas in corresponding panels above each magnified image. (B and C) Ultrastructural analysis of autophagosomes in the SNpc of control, CNTNAP4 AAV-shRNA, MPTP, and MPTP+CNTNAP4 siRNA groups. Magnified images in C are expansions of corresponding panels above in panel B. (D) Ultrastructural analysis of synaptic vesicles in SNpc of control, CNTNAP4 AAV-shRNA, MPTP, and MPTP+CNTNAP4 siRNA groups. Quantification of synaptic vesicles in panel D are shown in Figure S6. Scale bars for A, 125 µm in a-d, 25 µm in e-h, and 5 µm in i-l; scale bar for B, 5 µm; scale bar for C, 2 µm; and scale bar for D, 500 nm.

